Cardano (ADA/USDT) Faces Continued Bearish Pressure
Estimated Reading Time: 3 minutes
Don’t invest unless you’re prepared to lose all the money you invest. This is a high-risk investment and you are unlikely to be protected if something goes wrong. Take 2 minutes to learn more
Cardano Long-term Analysis: Bearish
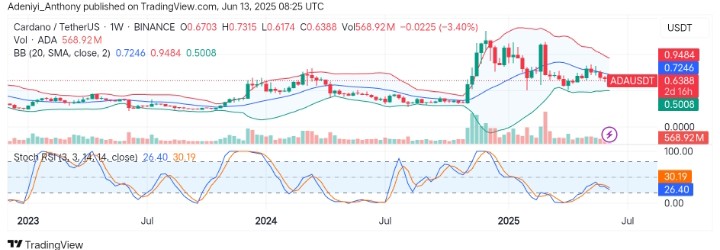
The market for Cardano against the Tether has faced significant rejection after hitting the $0.7315 high, dropping to a low of $0.6174 before a slight recovery. However, over the past year, the pair has struggled to break key resistance levels, as the current chart shows a bearish sentiment.
Recently, the Bollinger Bands suggested high volatility with expanding bands. However, the pair operates below the dynamic Bollinger Band level, indicating a bearish momentum, just as the Stochastic RSI pictures a strong sell position.
Currently, Cardano trades at $0.6388, recording a weekly loss of 3.40% with over 560 million traded volumes.
Technical Indicators
Major Resistance Levels: $0.7246, $0.7315, and $0.9484
Major Support Levels: $0.6174, $0.5008, and $0.4500
Cardano Technical Analysis
On the weekly timeframe, Cardano against the Tether has been in a downtrend, failing to sustain above the middle Bollinger Band at $0.7246, as the sharp rejection from $0.7325 indicates strong selling pressure. However, the widening bands suggest increased bearish actions as the price appears to be hugging the lower Bollinger band.
From another angle, the Stochastic RSI suggests a short-term bounce, but without increased bullish pressure, more southbound action may be seen as the lines are bent in that direction.
To this end, if the bulls fail to take the opportunity of the current dip, a break below $0.6174 would lead to a further downtrend.
ADA/USDT Analysis: What to Expect
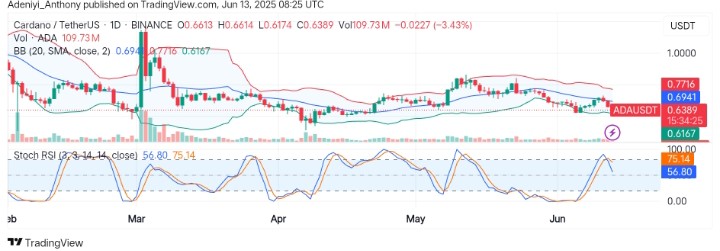
On the daily chart, ADA/USDT appears to be firm below the middle Bollinger band, signaling a bearish sentiment after rejection close to the upper band recently. However, the heightened volume seems to reinforce conviction behind the current selloff.
On the other hand, the bands appear to be expanding, indicating rising activities. However, the bearish crossover of the Stochastic RSI near the overbought region hints at further downside.
To this end, without a bullish reversal above the $0.6941 level, the pair may continue to experience further falls in price.
You can purchase crypto coins here. Buy LBlock