Cardano (ADA/USDT) Stuck Between Key Points as Momentum Drops
Estimated Reading Time: 3 minutes
Don’t invest unless you’re prepared to lose all the money you invest. This is a high-risk investment and you are unlikely to be protected if something goes wrong. Take 2 minutes to learn more
ADA/USDT Long-term Analysis: Ranging
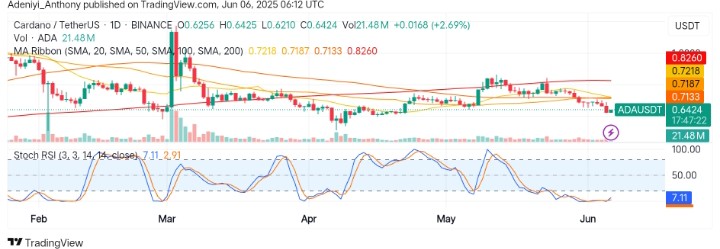
The market for Cardano against the Tether has shown signs of bearish consolidation, operating between vital moving averages. However, the pair’s price actions in recent times suggest a cool-off and being on the fence as the value hangs between the 50 and 100 simple moving averages.
As it stands, the Stochastic RSI appears to be heading into the oversold region, suggesting the pair is losing momentum while trading volume drops slightly. To this end, the pair market structure remains neutral despite bearish intention.
Currently, Cardano trades at $0.6425, recording 387.4 million traded volumes for the week.

Technical Indicators
Major Resistance Levels: $0.6450, $0.6948, and $0.7389
Major Support Levels: $0.5409, $0.5000, and $0.4100
Cardano Technical Analysis
On the weekly timeframe, Cardano against the Tether seems to be finding good support after dropping below $0.7000 in recent trading sessions. However, the price appears to be trapped between $0.6450 and $0.5409, suggesting a squeeze that may precede a breakout or breakdown.
From another angle, the Stochastic RSI beneath the weekly chart indicates a downturn as the lines reached for the south. To this end, price action above or below the key moving averages will determine the next price direction, as a decline in volume favors the bears.
ADA/USDT Analysis: What’s Next?
The analysis of the ADA/USDT trading pair on the daily chart shows the price is currently hovering under the cluster of the moving averages ribbon despite early gains. However, the volume contraction reflects reduced momentum as the pair appears to be forming a base around the current level.
On the other hand, the Stochastic RSI, though oversold, signals an improvement to the upside, which may be seen as soon as the blue line improves beyond 7.11. However, more confirmation is needed, reclaiming $0.6950 would flip the structure bullish. Conversely, a move below $0.5400 would suggest a further downtrend.
You can purchase crypto coins here. Buy LBlock