Cardano (ADA/USDT) Approaches Critical Support Level as Bulls Seek Reversal
Estimated Reading Time: 3 minutes
Don’t invest unless you’re prepared to lose all the money you invest. This is a high-risk investment and you are unlikely to be protected if something goes wrong. Take 2 minutes to learn more
Cardano Long-term Analysis: Ranging
After a strong bullish phase at the beginning of the year, Cardano against the Tether has faced a prolonged decline in value occasioned by consolidation periods at intervals. Despite this recent pullback, the market traders expect a turnaround, as the major indicators on the chart below suggest a potential reversal may be near.
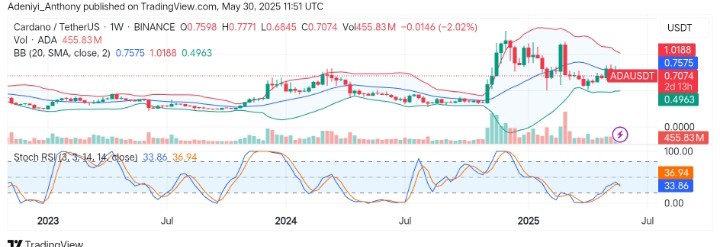
Recently, the ADA against the USDT has witnessed a substantial rally towards the $0.800 level before retracing to the current level, where the pair is experiencing a loss of about 2%. However, the current sideways movements suggest indecision as bullish traders hope for a bounce above the $0.4963 lower Bollinger Band level.
Currently, Cardano trades at $0.7074, printing over 450 million traded volumes for the week.
Technical Indicators
Major Resistance Levels: $0.7575, $0.8180, and $1.000
Major Support Levels: $0.6845, $0.6300, and $0.4963
Cardano Technical Analysis
The analysis of Cardano against the Tether on the weekly timeframe shows the value of the pair has been dwindling since the attempt to break above the $0.7575 resistance level. However, the appearance of the price around the mid-Bollinger Band suggests indecision, a structure that often precedes a breakout.
On the other hand, the Stochastic RSI appears to be heading to the south after the recent bullish momentum, which has faced a severe stop. However, the line has displayed a bearish crossover, but renewed interest in the pair may change the course of things as selling momentum appears to be waning.
To this end, if the momentum can hold above $0.6000 even as the market seems to be dominated by the bears, a rekindled interest by the bulls may push the price toward $1.000 in the coming session. Conversely, a fall in value beyond the stated level would invalidate this move.
ADA/USDT Analysis: What’s Next?
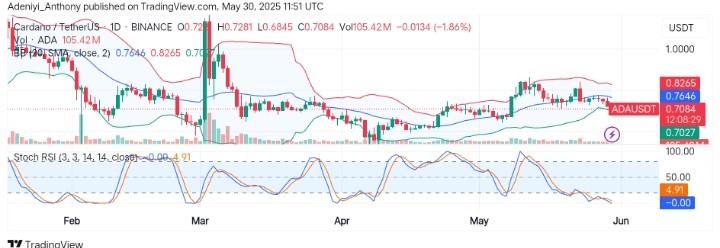
On the daily chart, ADA/USDT appears to be in a continued downtrend as the price approaches the lower band, indicating a short-term bearish pressure as $0.7027 acts as a potential support. However, the deeply oversold condition of the momentum oscillator suggests a possible reversal attempt might be on the way, but at the moment the volume suggests a lack of strength from the bulls.
To this end, only strong bullish momentum can push the price above the mid-band at $0.7646; otherwise, a continued decline in value would invite a move towards $0.6300.
You can purchase crypto coins here. Buy LBlock