Storj Market (STORJ/USD): Bearish Momentum Triggered, Yet Bulls Emerge to Revive the Trend
Estimated Reading Time: 2 minutes
Don’t invest unless you’re prepared to lose all the money you invest. This is a high-risk investment and you are unlikely to be protected if something goes wrong. Take 2 minutes to learn more
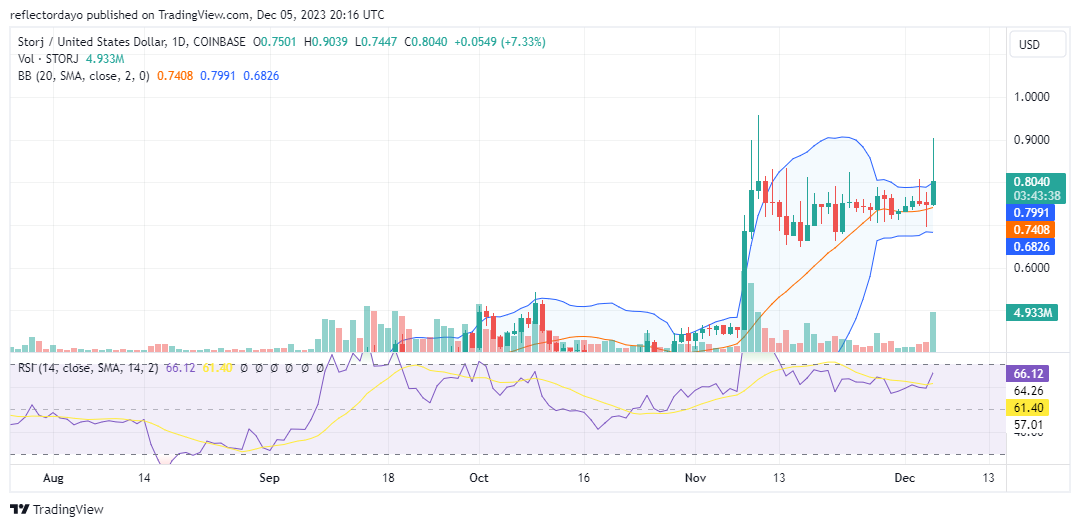
In a recent development, the Storj market experienced a notable surge of 17.94%, propelling it to the $0.9000 price level. However, this surge triggered significant bearish momentum. It is commonly observed that robust bullish trends can be followed by strong bearish movements as traders seek to capitalize on market gains around the $0.900 level to secure profits.
The Storj Market Data
- STORJ/USD Price Now: $0.8050
- STORJ/USD Market Cap: $306,504,9185
- STORJ/USD Circulating Supply: 382,350,349 STORJ
- STORJ/USD Total Supply: 424,999,998 STORJ
- STORJ/USD CoinMarketCap Ranking: #135
Key Levels
- Resistance: $0.900, $0.950, and $1.000.
- Support: $0.750, $0.700, and $0.650.
The Storj Market Forecast: Analyzing the Indicators
Despite the emergence of a considerable bearish market phase subsequent to the recent hyperbullish conditions, bullish intervention appears evident around the $0.800 price level. This level may serve as a potential higher support, forming a pivotal point for the continuation of the bullish trend. The robust volume histogram in the trade indicator instills confidence that the Storj market bulls could retain control. Anticipation is high for the next daily trading session, which may witness significant bullish momentum, potentially establishing the market above the $0.800 price threshold.
STORJ/USD 4-Hour Chart Outlook
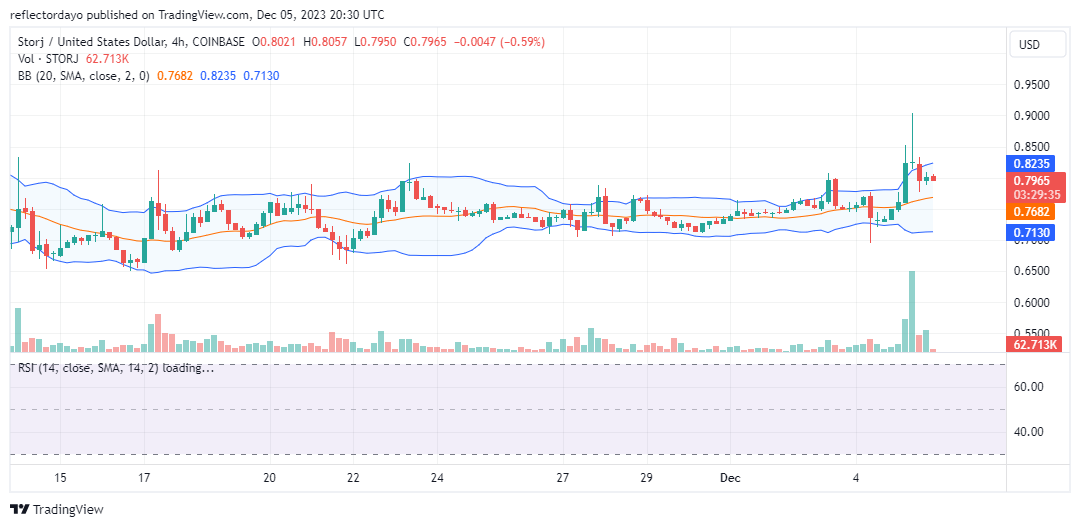
Upon examination of the 4-hour chart, it is observed that demand and supply are converging around the $0.800 price level. Despite significant participation from both bulls and bears, the price is exhibiting a relatively flat trend in the vicinity of $0.800. This observation may suggest the formation of a robust demand level at this point, potentially serving as a pivotal factor for the continuation of the bullish trend.