Bitcoin Cash (BCH/USD) Retraces Resistance at $270, Testing October 24th Level
Estimated Reading Time: 3 minutes
Don’t invest unless you’re prepared to lose all the money you invest. This is a high-risk investment and you are unlikely to be protected if something goes wrong. Take 2 minutes to learn more
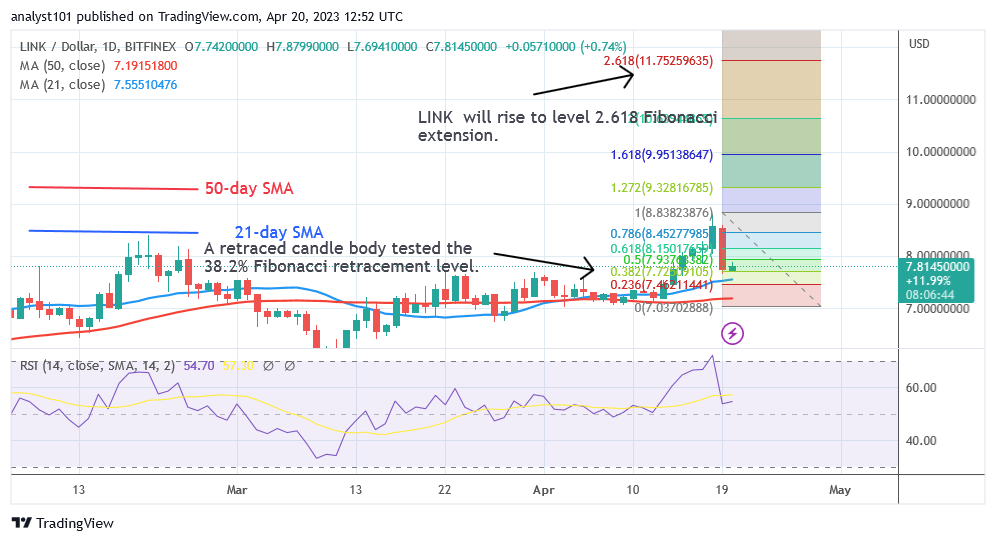
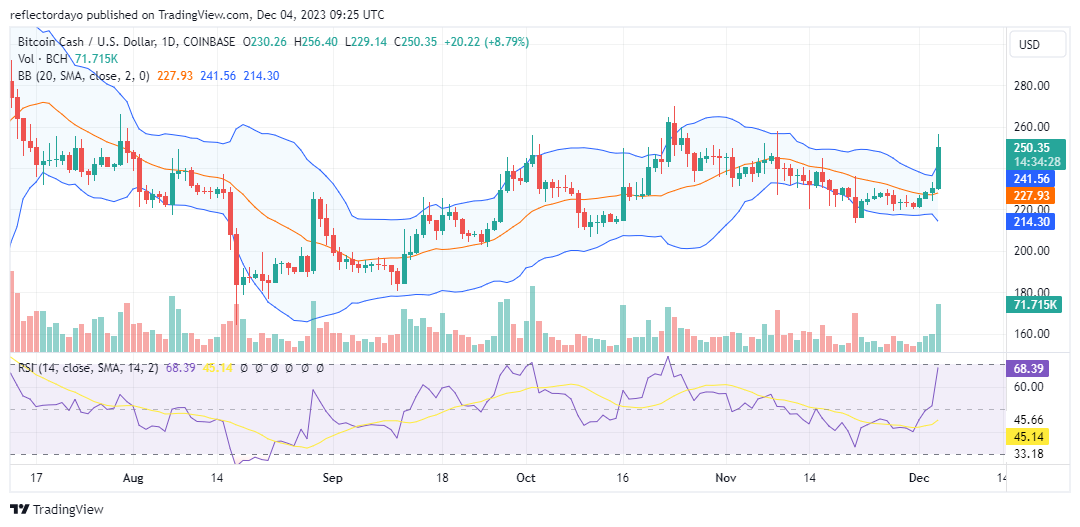
On August 18, bullish traders strategically intervened at the $180 price level to curtail the robust bearish trend observed between August 16 and August 17. Subsequently, amid ongoing volatility and a discernible equilibrium between demand and supply, the bulls successfully established higher lows. This development has fostered bullish momentum, propelling the market towards a recovery and higher price levels.
Bitcoin Cash Market Data
- BCH/USD Price Now: $251.40
- BCH/USD Market Cap: $4,896,947,590
- BCH/USD Circulating Supply: 19,576,444 BCH
- BCH/USD Total Supply: 19,576,444 BCH
- BCH/USD CoinMarketCap Ranking: #19
Key Levels
- Resistance: $260, $270, and $280.
- Support: $230, $220, and $210.
Bitcoin Cash Market Forecast: Analyzing the Indicators
On October 24, Bitcoin Cash bulls successfully propelled the market to an upward price level, reaching a peak of $270. Despite occasional bearish pressure throughout the bull market that led to this high, the bulls maintained control. However, following the market’s peak at $270, the bearish sentiment gained strength, leading to a downturn. Bulls intervened at the $220 price level, effectively curbing the bear market. In today’s market, the price has initiated a retracement from the October 24 resistance at $270.
While the bullish candlestick signals strength in the bull market, the upper shadow indicates a lingering bearish sentiment around the $260 price level. The volume of trade indicator displays a significant histogram, reinforcing the ongoing bullish movement. This signal from the volume of trade indicator provides bullish traders with the conviction to consider long trading positions.
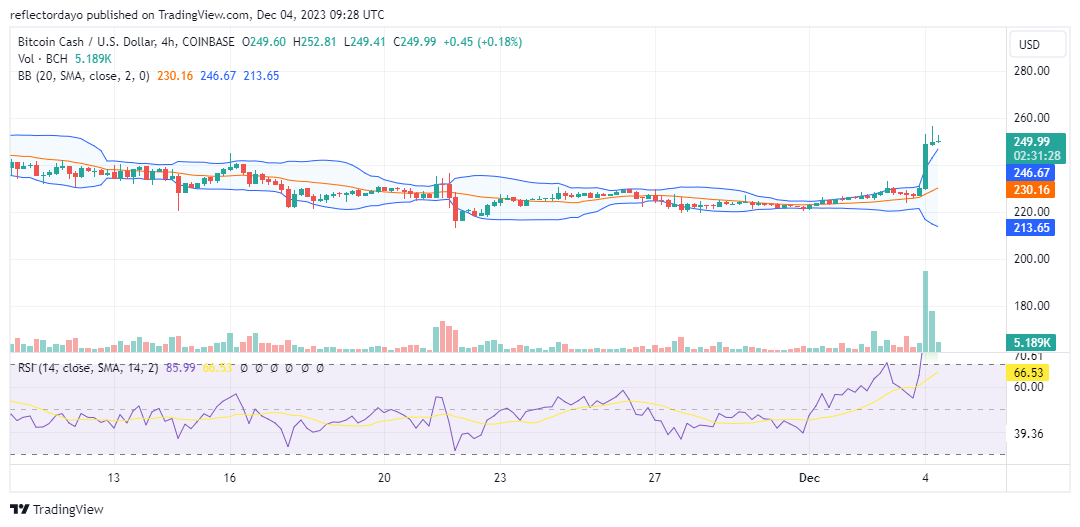
BCH/USD 4-Hour Chart Outlook
The 4-hour chart’s analysis of Bollinger Bands indicates that the recent aggressive bullish activities have pushed the market into the overbought region. Consequently, the last two candles, representing the latest two 4-hour sessions, feature inverted hammer candlesticks, suggesting a concentration of sell orders near the $260 price level. This market dynamic has led to a decline in trading volume. While the upper standard deviation curve of the Bollinger Bands is more divergent than the lower standard deviation curve, there is a possibility that the market will consolidate around the current price. This consolidation could serve to fortify the level as either a support or a resistance.