Immutable X (IMX/USD) Prepares to Reclaim the $1.400 Price Level
Estimated Reading Time: 3 minutes
Don’t invest unless you’re prepared to lose all the money you invest. This is a high-risk investment and you are unlikely to be protected if something goes wrong. Take 2 minutes to learn more
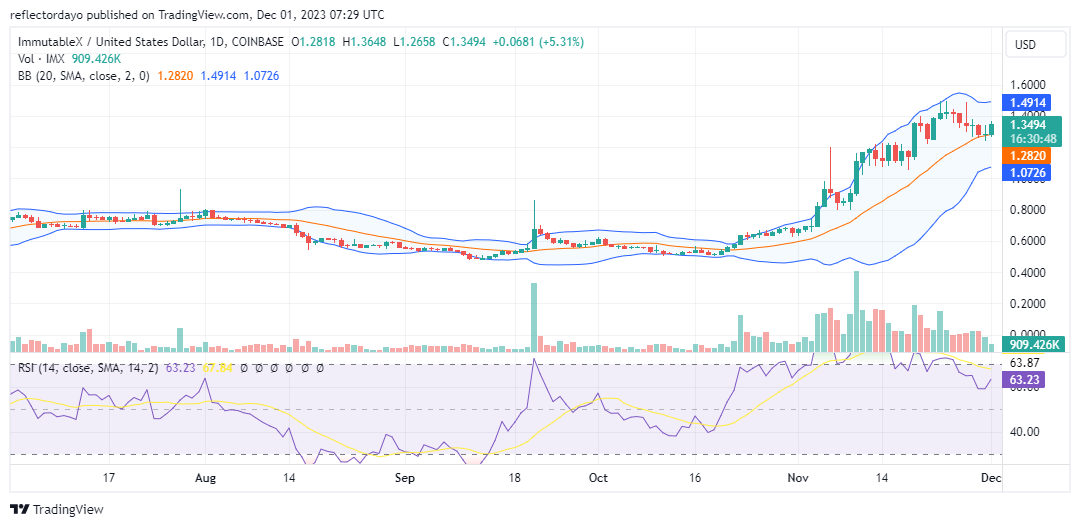
The Immutable X market has experienced a ranging pattern since approximately June, hovering around the $0.700 price level before stabilizing at the $0.5500 price level in August. Subsequently, bullish momentum emerged towards the end of October, accompanied by a surge in trading volume. This heightened volatility in the bull market led to the breaking of key resistance levels, ultimately propelling the market to the $1.400 price level.
Immutable Market Data
- IMX/USD Price Now: $1.3535
- IMX/USD Market Cap: $1,736,800,709
- IMX/USD Circulating Supply: 1,285,494,242 IMX
- IMX/USD Total Supply: 2,000,000,000 IMX
- IMX/USD CoinMarketCap Ranking: #39
Key Levels
- Resistance: $1.400, $1.450, and $1.500.
- Support: $1.200, $1.150, and $1.110
Immutable X Market Forecast: Analyzing the Indicators
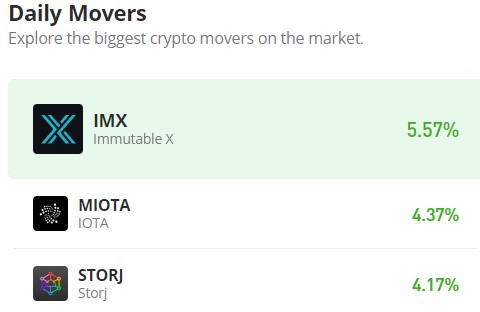
As Immutable X reached the $1.400 price level, it entered a period of consolidation, indicating a significant resistance point. Today’s observed 5.6% gain suggests potential bullish activity, with traders exerting pressure around $1.278 in an effort to breach the $1.400 level. Historical data reveals a prior stabilization period around the $1.200 price level from November 12 to November 19, and a similar trend may emerge, securing strong support levels around $1.300 and $1.400. This could potentially propel the market towards the $1.600 price level.
The Relative Strength Index (RSI) indicates a recovery in bullish momentum, rising from 58 to 63, affirming the dominance of bulls over bears. However, a notable concern arises from diminishing trade volume, hinting at potential market indecision among traders. This could lead to a consolidation phase around the $1.400 price level.
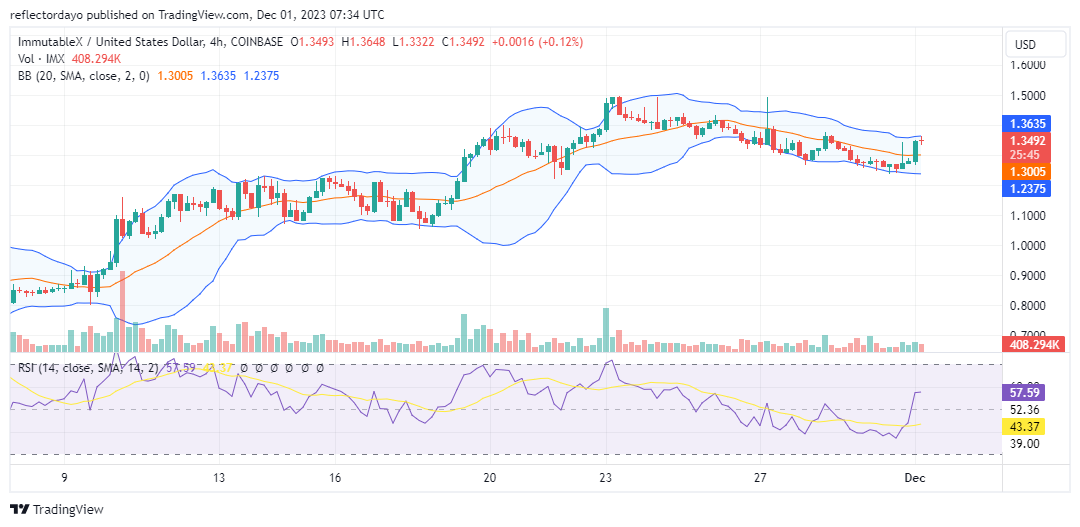
IMX/USD 4-Hour Chart Outlook
The current 4-hour trading timeframe is marked by a notable demand and supply standoff. A plus-sign doji pattern is indicative of the ongoing 4-hour trading session, signaling a significant resistance level at the $1.3500 price point. Following the formation of the plus sign doji, two potential scenarios emerge: either the market takes a bearish turn or it consolidates at the present price level to fortify this specific level, paving the way for further bullish momentum.