The Ankr Market (ANKR/USD) to Resume Bullish Run Soon
Estimated Reading Time: 3 minutes
Don’t invest unless you’re prepared to lose all the money you invest. This is a high-risk investment and you are unlikely to be protected if something goes wrong. Take 2 minutes to learn more
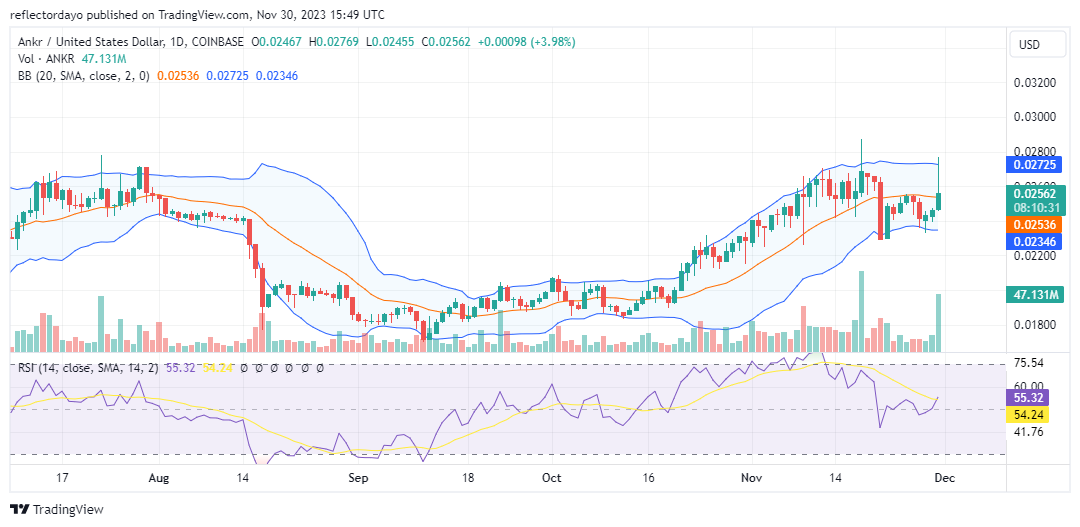
On October 12, the Ankr market entered a bullish trend. The bull market commenced around the $0.0185 support price level, gaining momentum and surpassing multiple resistance levels until encountering a notable barrier at the $0.027 price level. However, the prevailing bullish sentiment in the market persisted and stabilized at the $0.0228 price level. Bulls intervened at this juncture in an attempt to retest the critical $0.027 resistance price level.
The Ankr Market Data
- ANKR/USD Price Now: $$0.02573
- ANKR/USD Market Cap: $256,568,114
- ANKR/USD Circulating Supply: 10,000,000,000 ANKR
- ANKR/USD Total Supply: 10,000,000,000 ANKR
- ANKR/USD CoinMarketCap Ranking: #148
Key Levels
- Resistance: $0.026, $0.027, and $0.028.
- Support: $0.023, $0.022, and $0.021
The Ankr Market Forecast: Analyzing the Indicators
The Ankr bear market initiated at the critical $0.027 resistance level held significant implications. Initially, on November 19 and 20, bullish traders endeavored to counteract the bearish trend. This is evidenced by the hammer candlesticks, which accurately depict the trading dynamics for those two days. The presence of these hammer candlesticks likely alerted traders to the impending bullish market movement.
Subsequent to the robust bear market on November 21, a bullish resurgence ensued, with buyers reclaiming control and propelling the price towards the $0.028 level, traditionally associated with bearish sentiment. Although a substantial bear market ensued at this level, bulls have maintained their influence over the market.
The current activities of the bears in today’s market are reflected in the upper shadow of the candlestick, symbolizing the day’s trading events.
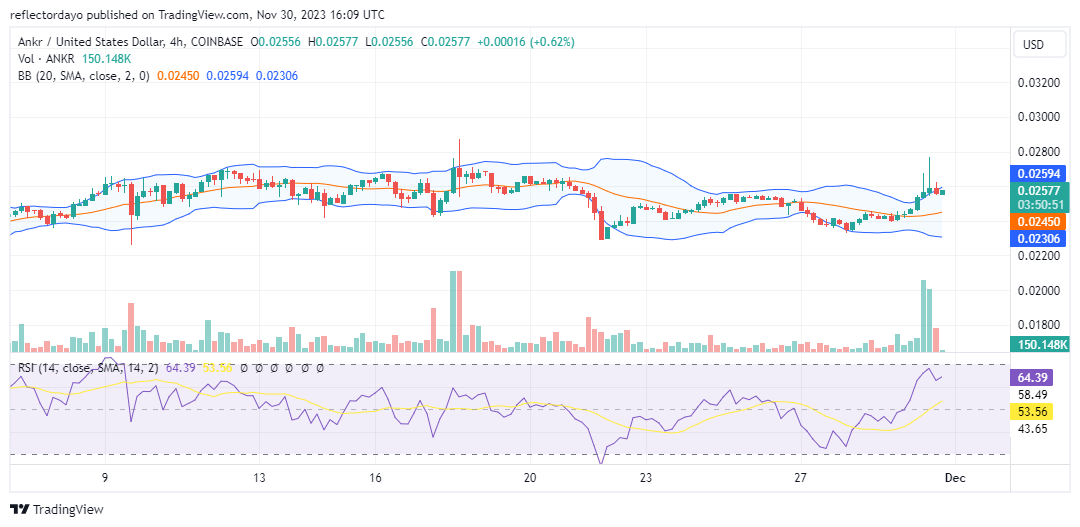
ANKR/USD 4-Hour Chart Outlook
Buyers are asserting themselves by establishing a higher support level at the $0.024 price point, presently resisting bearish pressure at the $0.026 level. The volume of trade indicator is presently indicating a reduction in trading volume. This decrease may signify a decline in volatility, potentially leading to price consolidation around the $0.026 level. Such consolidation could result in the market stabilizing at this price point, solidifying it as both a support level and a pivot for further bullish price actions.