Solana (SOL/USD) Surpassing the $60 Resistance Level
Estimated Reading Time: 2 minutes
Don’t invest unless you’re prepared to lose all the money you invest. This is a high-risk investment and you are unlikely to be protected if something goes wrong. Take 2 minutes to learn more
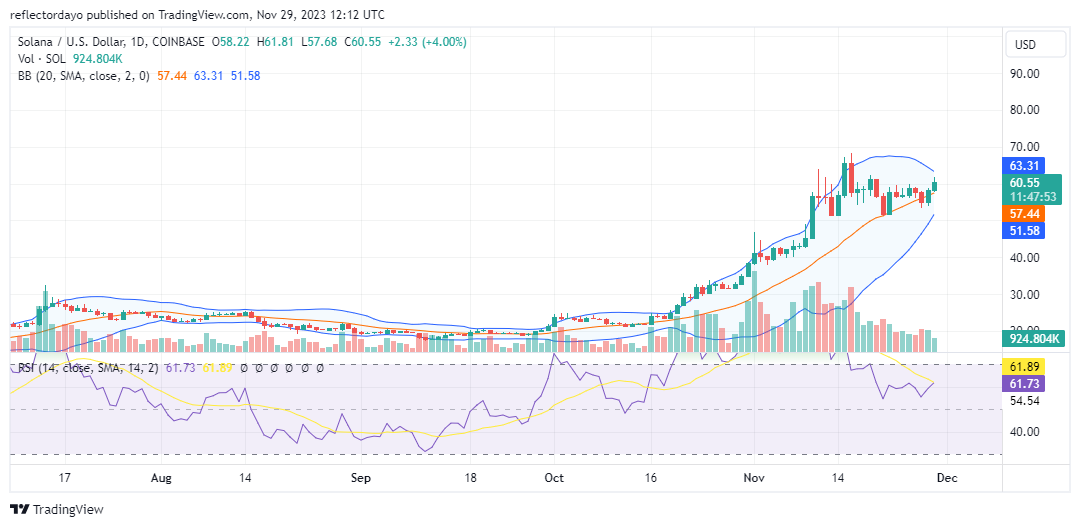
The Solana market has demonstrated a notable upward trend since October, surpassing the $60 price level, albeit encountering substantial resistance at this threshold. Following the resistance encountered around the $60 price level since November 17, the market has exhibited a sideways movement in proximity to this price point. Presently, in today’s market, the price is breaking above the $60 level, suggesting a potential trajectory toward the $70 price level.
Solana Market Data
- SOL/USD Price Now: $61
- SOL/USD Market Cap: $25,776,929,356
- SOL/USD Circulating Supply: 423,517,664 SOL
- SOL/USD Total Supply: 563,673.664 SOL
- SOL/USD CoinMarketCap Ranking: #
Key Levels
- Resistance: $70.00, $75.00, and $80.00.
- Support: $50.00, $45.50, and $40.00.
Solana Price Forecast: Analyzing the Indicators
Over the past two weeks, the market has exhibited consolidation around the $60 price level, accompanied by the convergence of Bollinger Bands around the price action, signaling a potential volatility squeeze. This suggests a possible preparation for another upward price movement. As per the Relative Strength Index (RSI), the bullish momentum is currently measured at 61, indicating that bulls remain in control and maintain an advantageous position over the bears.
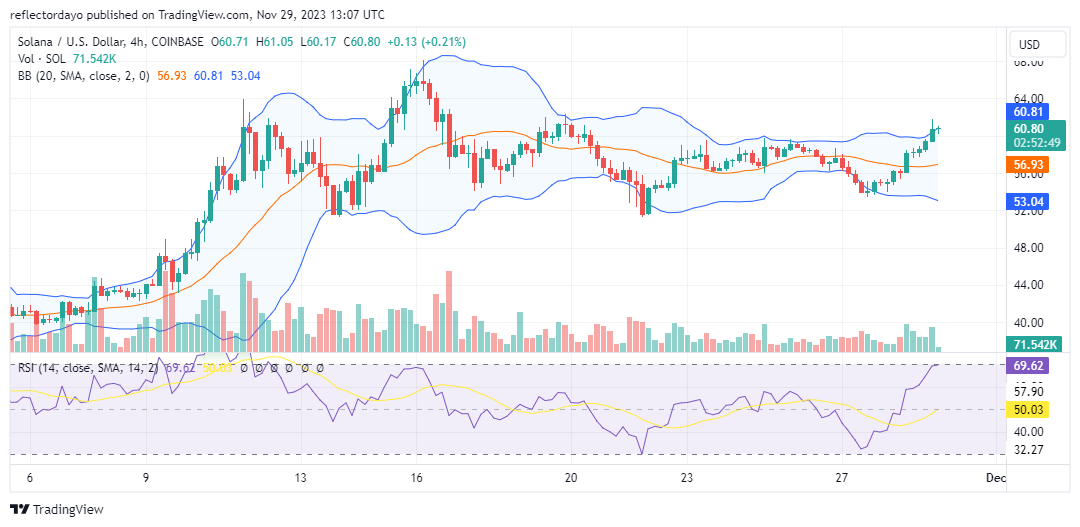
SOL/USD 4-Hour Chart Outlook
The Solana market, observed from a 4-hour timeframe perspective, is depicted as ranging sideways around the $60 price level. The trade volume indicator is now indicating an increase in market activity. Despite the clustering of sell orders above the $60 price level, bullish momentum is prevailing, and there is potential for the market to advance toward the $70 price level.