Litecoin (LTC) Price Prediction: LTC/USDT Keeps Descending
Estimated Reading Time: 2 minutes
Don’t invest unless you’re prepared to lose all the money you invest. This is a high-risk investment and you are unlikely to be protected if something goes wrong. Take 2 minutes to learn more

Date: May 27, 2025
The Litecoin market appears to be closely tracking the performance of the Bitcoin market. Recently, price action surged from just above $80 to trade above the $100 level. However, headwinds seem to have caused the market to retrace lower, and it now trades around the $94 mark.
LTC/USDT Long-Term Trend: Bullish (Daily Chart)
Key Price Levels:
Resistance: $96, $100, $105
Support: $92, $88, $84
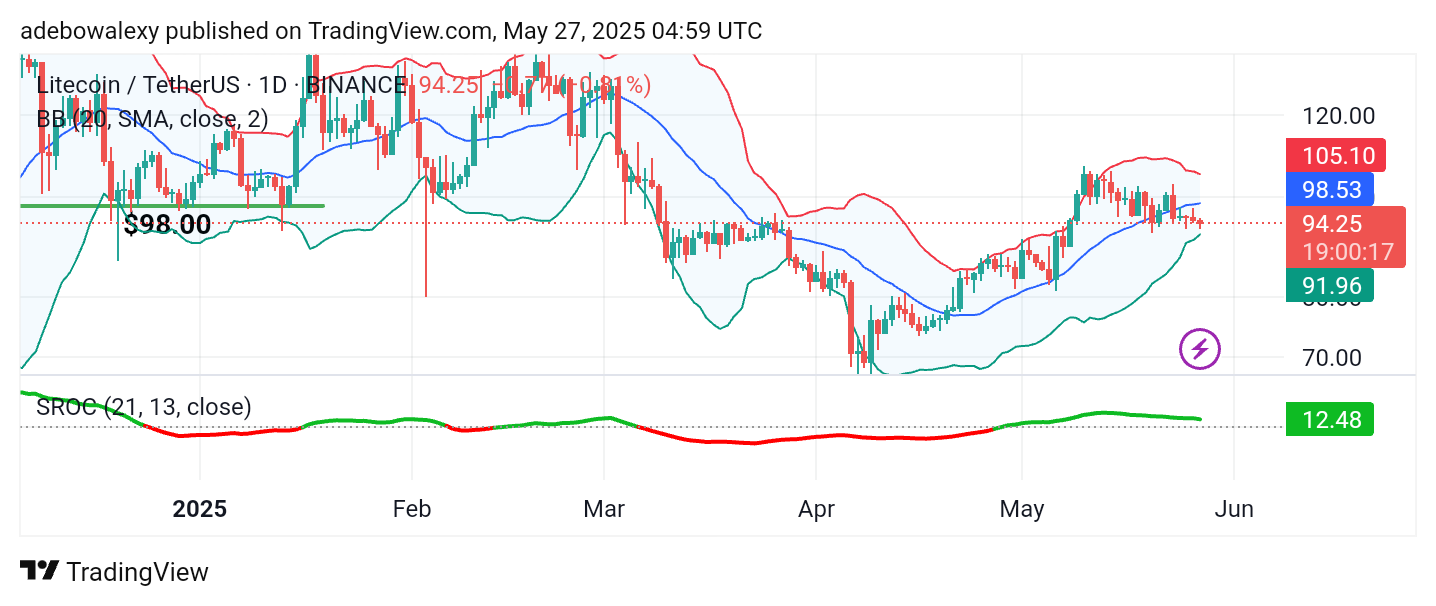
Price activity on the Litecoin daily chart has steadily declined toward the middle Bollinger Band over recent sessions. In the past four sessions, price action dipped below the middle Bollinger Band. The latest price candle is bearish and has kept the market below the midline of the Bollinger Bands. Meanwhile, the Smoothed Rate of Change (SROC) indicator remains above the equilibrium level, maintaining a green signal. At the same time, the Bollinger Bands continue to contract, while price action stays below the equilibrium line.
Litecoin (LTC) Price Prediction: LTC/USDT Bulls Stay Subdued
Price action on the Litecoin daily chart generally suggests that bearish sentiment has strengthened. Price has fallen below the key middle level of the Bollinger Bands.
The latest red candle shows minimal downward retracement but still reflects continued pressure. Despite this, the SROC indicator remains above the equilibrium level. This suggests that bullish momentum may simply be on a short pause, with the potential to resume soon. Therefore, traders can anticipate a possible upward rebound.
Litecoin (LTC) Price Prediction: LTC/USDT Tests Lower Support
In the 4-hour chart, Litecoin’s price action is hovering just above the lower boundary of the Bollinger Bands. The Bollinger Bands have contracted slightly further, indicating reduced volatility.
Nevertheless, the price remains below the middle line of the Bollinger Bands. Meanwhile, the SROC indicator is moving sideways just below the equilibrium level. This sideways movement suggests that bearish momentum is weakening, supporting the broader sentiment that a rebound toward the $100 price level remains possible.