Dogecoin (DOGE) Price Prediction: DOGE/USDT Hovers Around Key Technical Levels
Estimated Reading Time: 2 minutes
Don’t invest unless you’re prepared to lose all the money you invest. This is a high-risk investment and you are unlikely to be protected if something goes wrong. Take 2 minutes to learn more

Date: May 26, 2025
The Dogecoin market has sustained a bullish outlook over the past sessions. Even the applied technical indicators still largely support the view that upward momentum is persisting—lingering and waiting for the right time to resume action.
DOGE/USDT Long-Term Trend: Bullish (Daily Chart)
Key Price Levels:
Resistance: $0.2500, $0.3000, $0.3500
Support: $0.2000, $0.1500, $0.1000
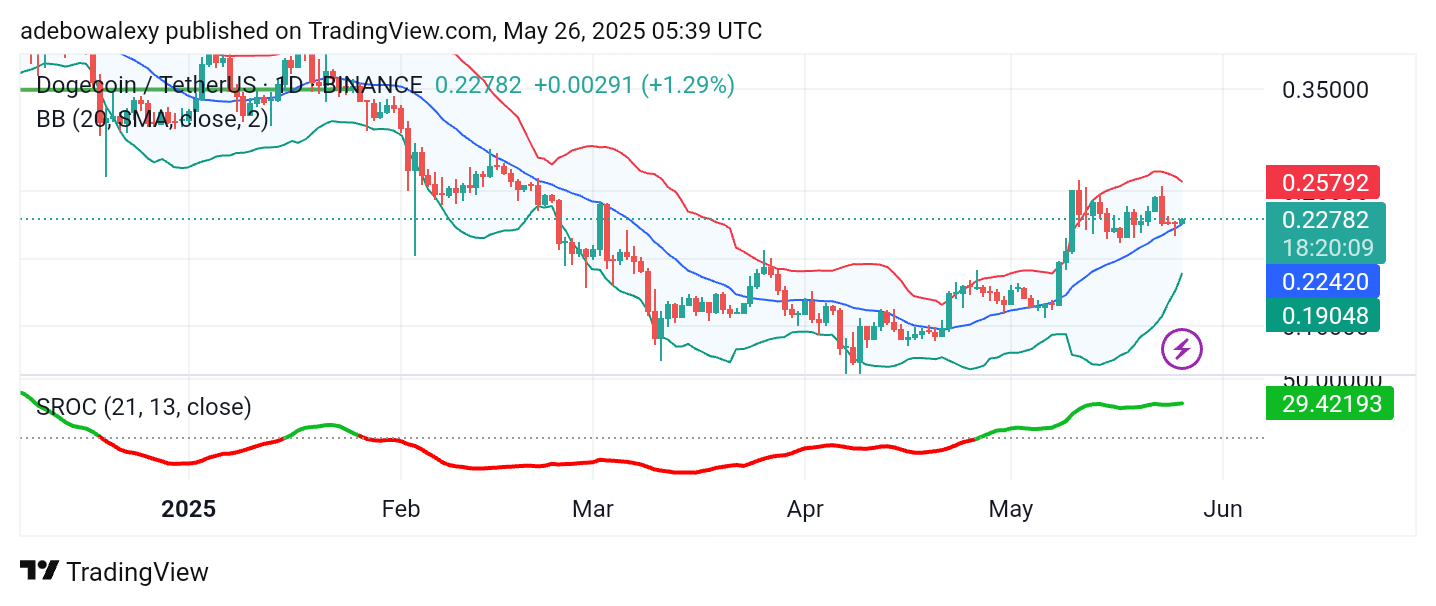
The price candle for the current session in the Dogecoin market is green, indicating a potential rebound upward from the middle band of the Bollinger Bands. Furthermore, both the upper and lower bands of the Bollinger indicator continue to contract. Similarly, the lines of the Smoothed Rate of Change (SROC) indicator remain above the equilibrium level, with the main line slightly tilted upward, further supporting bullish sentiment.
Dogecoin (DOGE) Price Prediction: DOGE/USDT Poised for Uptrend Continuation
As noted earlier, price action in the Dogecoin daily chart may be initiating another upward movement. This view is supported by the fact that the most recent price candle appears to have bounced off a key technical support level.
Meanwhile, the Bollinger Bands are beginning to shape into a configuration that suggests a bullish move. The SROC indicator also rises slightly above the equilibrium level. These developments suggest that upward momentum may continue in the near term.
Dogecoin (DOGE) Price Prediction: DOGE/USDT Upside Rebound Appears Consistent
On the 4-hour chart, Dogecoin’s price action has shown only minimal gains over the past four sessions. The latest price candle is currently testing the resistance at the middle band of the Bollinger Bands.
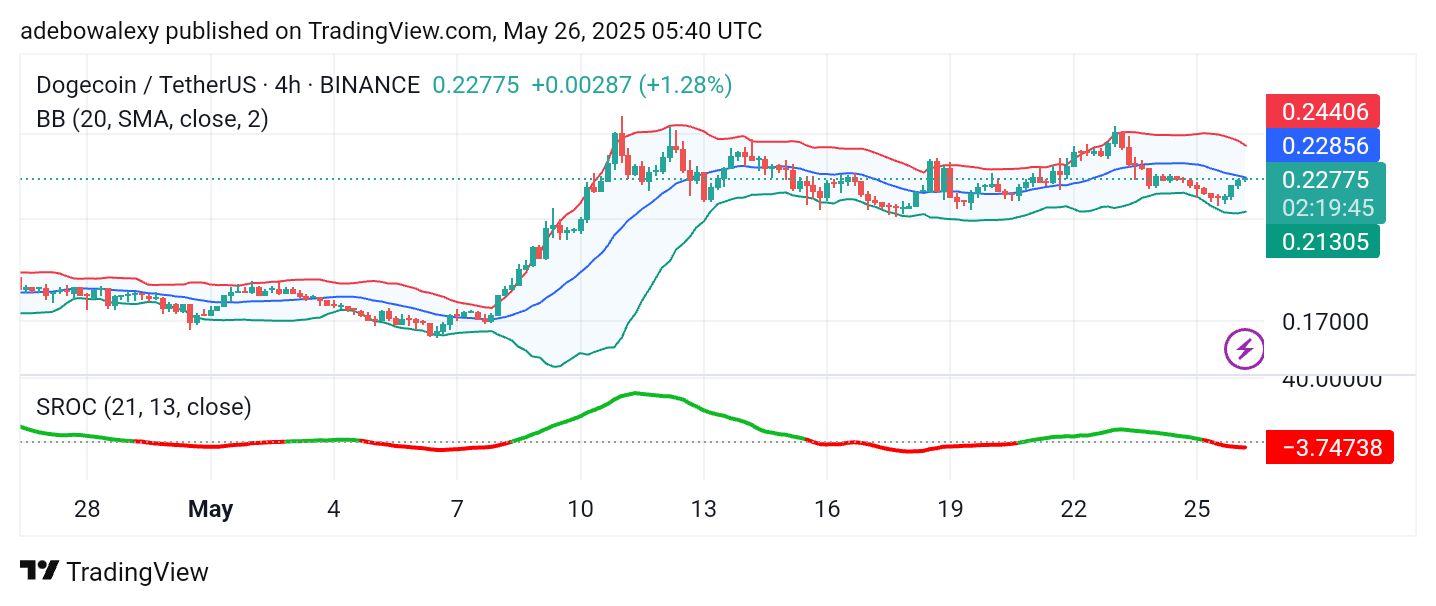
Additionally, the SROC indicator has dipped slightly below the equilibrium level, and its trajectory appears to be moving sideways. However, if price action resurfaces above the middle band of the Bollinger indicator, we may see the market attempt to reach the $0.2500 resistance level.