Synthetix (SNXUSD) Resumes the Market Trend in an Upward Direction
Estimated Reading Time: 2 minutes
Don’t invest unless you’re prepared to lose all the money you invest. This is a high-risk investment and you are unlikely to be protected if something goes wrong. Take 2 minutes to learn more

Free Crypto Signals Channel
 Free Telegram Channel
SNXUSD Analysis – The Market Resumes a Trend in an Upward Direction
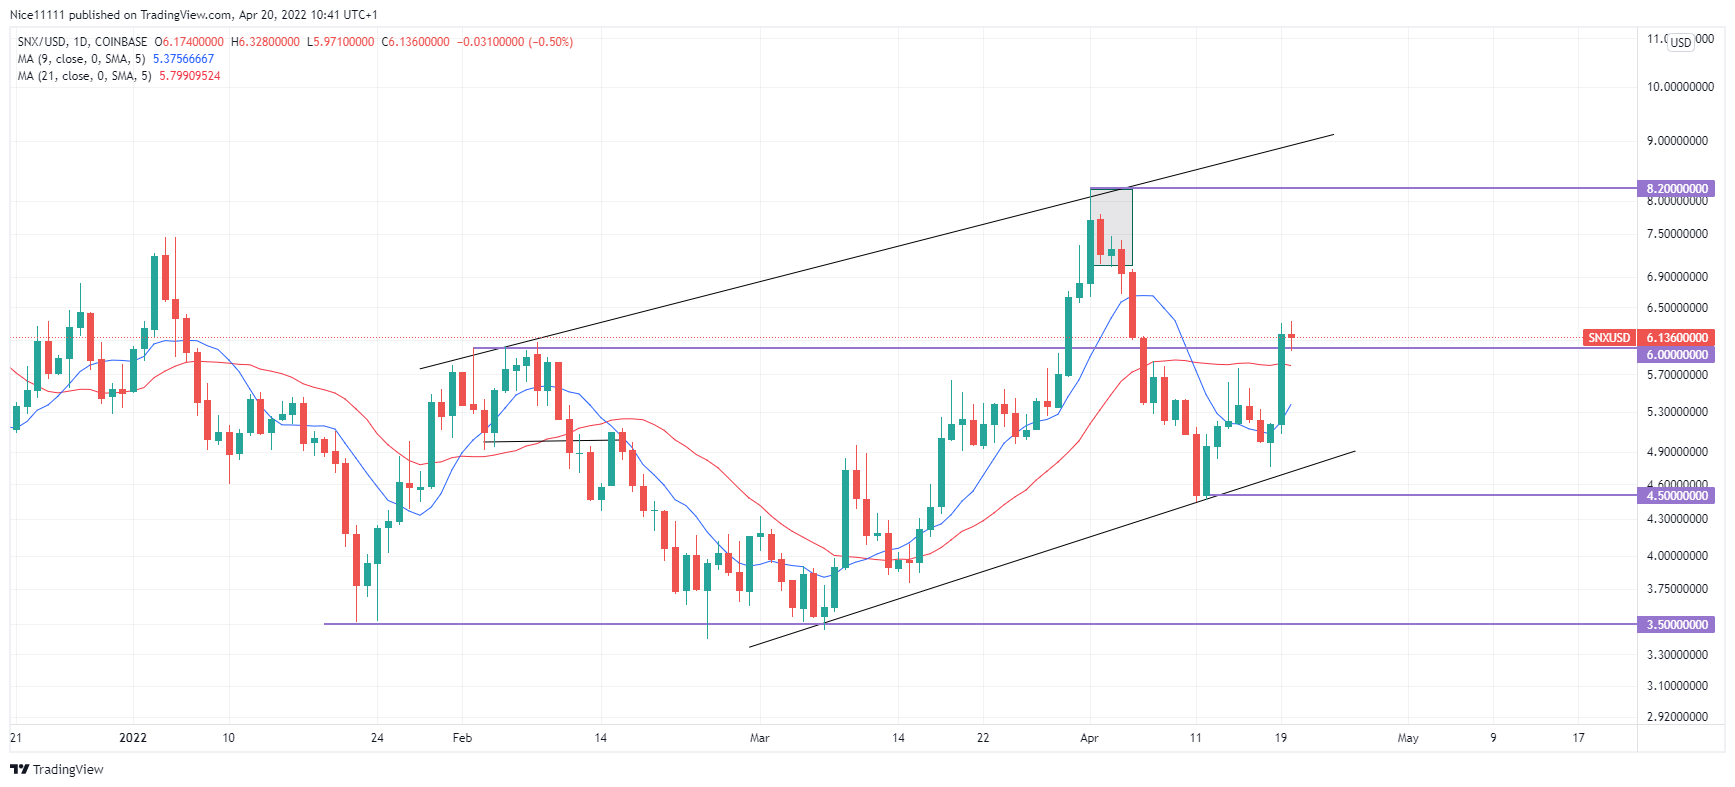
SNXUSD resumes the market trend in an upward direction from the $4.50 demand zone. The market was faced with a downtrend throughout January. The market crashed to a $3.50 demand zone on the 22nd of January. Multiple rejections formed during the period. This led to a shift in the market. The market rallied from the demand zone to $6.00, where it faced resistance.
SNXUSD Major Zone
Demand Zone: $3.50, $4.50
Supply Zone: $6.00, $8.20
A double top was formed below the $6.00 resistance zone. There was a break in the structure with the bearish candle on the 11th of February. This caused a change in the direction of the market trend. The Moving Average period nine crossed to the lower side of the Moving Average period of twenty-one. The market crashed back to the demand zone at $3.50.
On the 8th of March, there was a swing low in the market in the demand zone. The previous highs were cleared with the bullish candle on the 9th of March. The Moving Averages crossed to show bullishness in the market. The Moving Average crossed to further confirm the market trend in the upward direction. This caused the market to resume a bullish trend to the next supply zone at $6.00.

Market Expectation
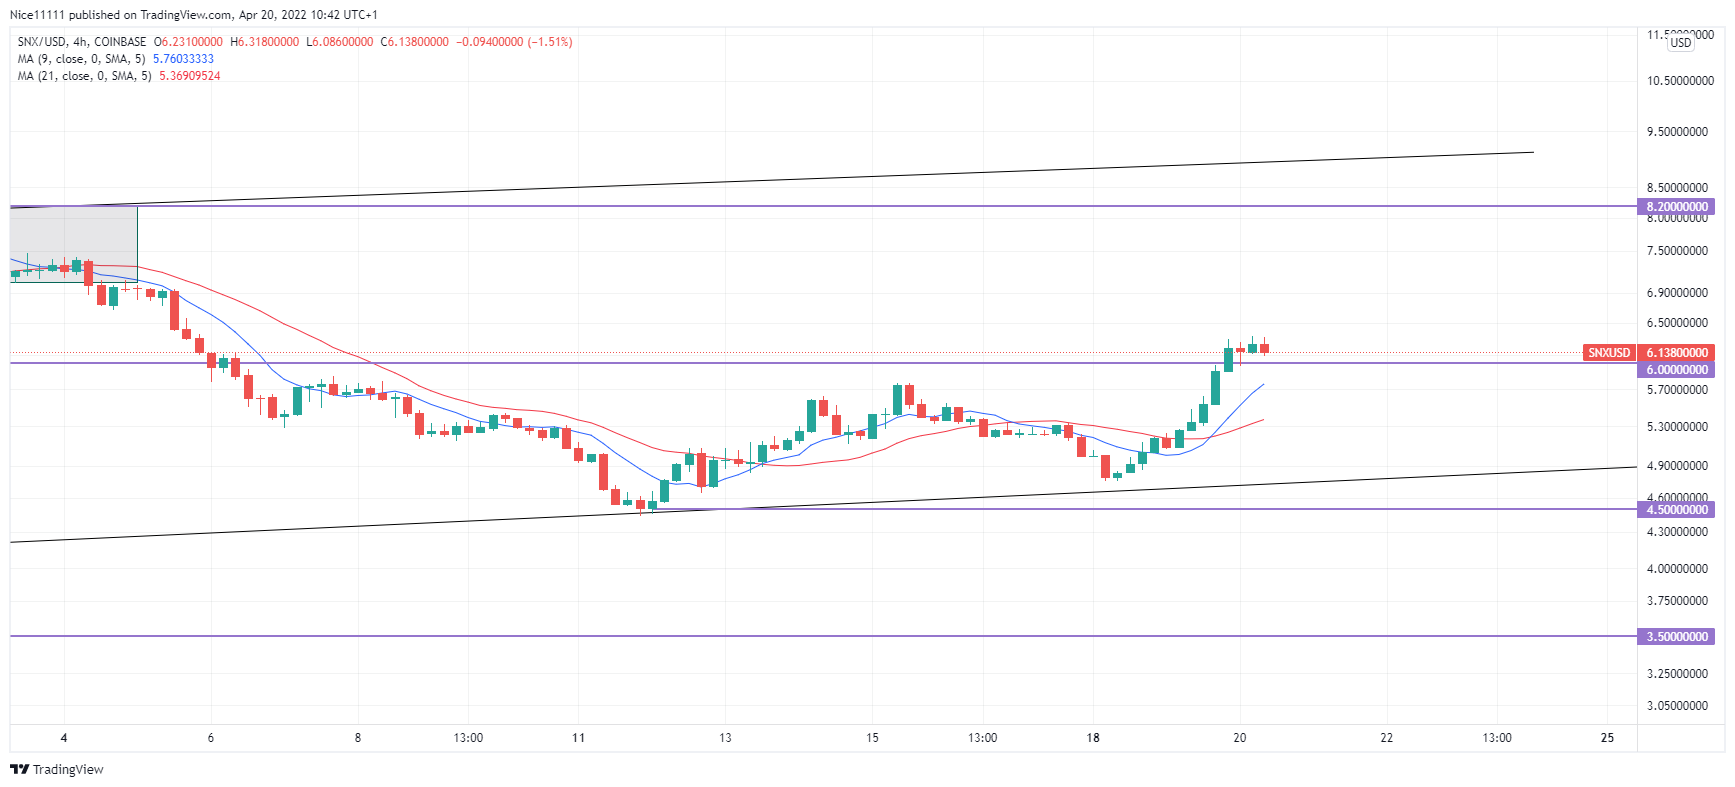
The bulls eventually struck the $8.20 supply zone. A swing high formed below the supply zone at $8.20. The market retraced to the $4.50 zone to gather bullish momentum. The previous highs on the 15th of April have been swept. SNXUSD has resumed the market’s trend in an upward direction. The market is expected to push back to the supply zone at $8.20.
How To Buy Lucky Block
Note: Cryptosignals.org is not a financial advisor. Do your research before investing your funds in any financial asset or presented product or event. We are not responsible for your investing results.