Polygon (ex-MATIC) Price Prediction: POL/USDT Hovers Around Key Technical Levels
Estimated Reading Time: 3 minutes
Don’t invest unless you’re prepared to lose all the money you invest. This is a high-risk investment and you are unlikely to be protected if something goes wrong. Take 2 minutes to learn more

Date: May 24, 2025
Following recent price surges in the Bitcoin market, some other altcoins have been experiencing notable changes in bullish sentiment. Polygon (formerly MATIC) is among the coins benefiting from these positive shifts. As a result, its price action continues to hover around important technical landmarks.
POL/USDT Long-Term Trend: Bullish (Daily Chart)
Key Price Levels:
Resistance: $0.2500, $0.3000, $0.3500
Support: $0.2000, $0.1500, $0.1000
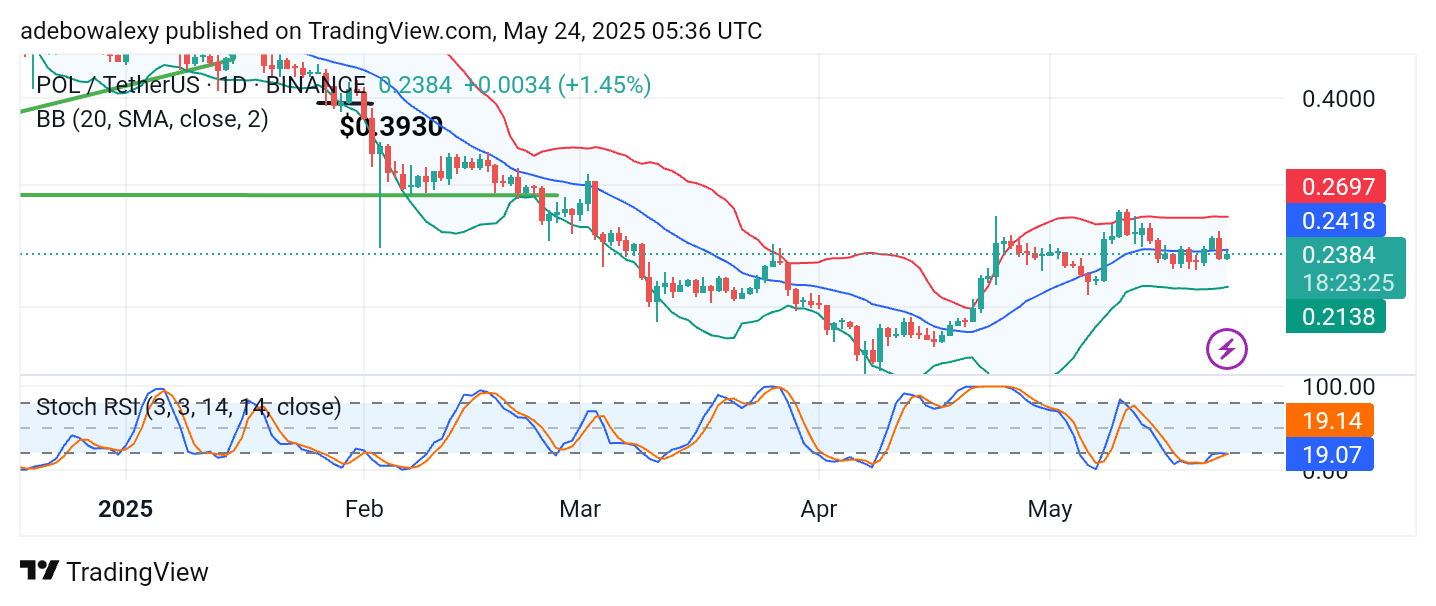
Price activity in the Polygon (ex-MATIC) daily market has been oscillating around the middle Bollinger Band. The corresponding price candle for the ongoing session is green. In the previous session, however, price action dipped below the middle band. The lines of the Stochastic Relative Strength Index (Stochastic RSI) indicator are currently converged but have not yet formed a downward crossover at the time of writing.
Polygon (ex-MATIC) Price Prediction: POL/USDT May Bounce Back
Price activity in the Polygon (ex-MATIC) market appears to be clustering around important technical landmarks. The last price candle on the chart is green, suggesting a potential move toward the middle Bollinger Band. Meanwhile, the Stochastic RSI indicator lines are generally pointing upward.
Although the convergence at their terminals hints at possible weakness, the appearance of the latest green candle suggests that further downward retracement may be halted.
Polygon (ex-MATIC) Price Prediction: POL/USDT Holds Tightly to Upside Hopes
In the Polygon (ex-MATIC) 4-hour price chart, we observe that price activity is currently below the middle Bollinger Band. The latest candle is a small red one. Despite this, gains from the previous session still outweigh the current mild retracement.
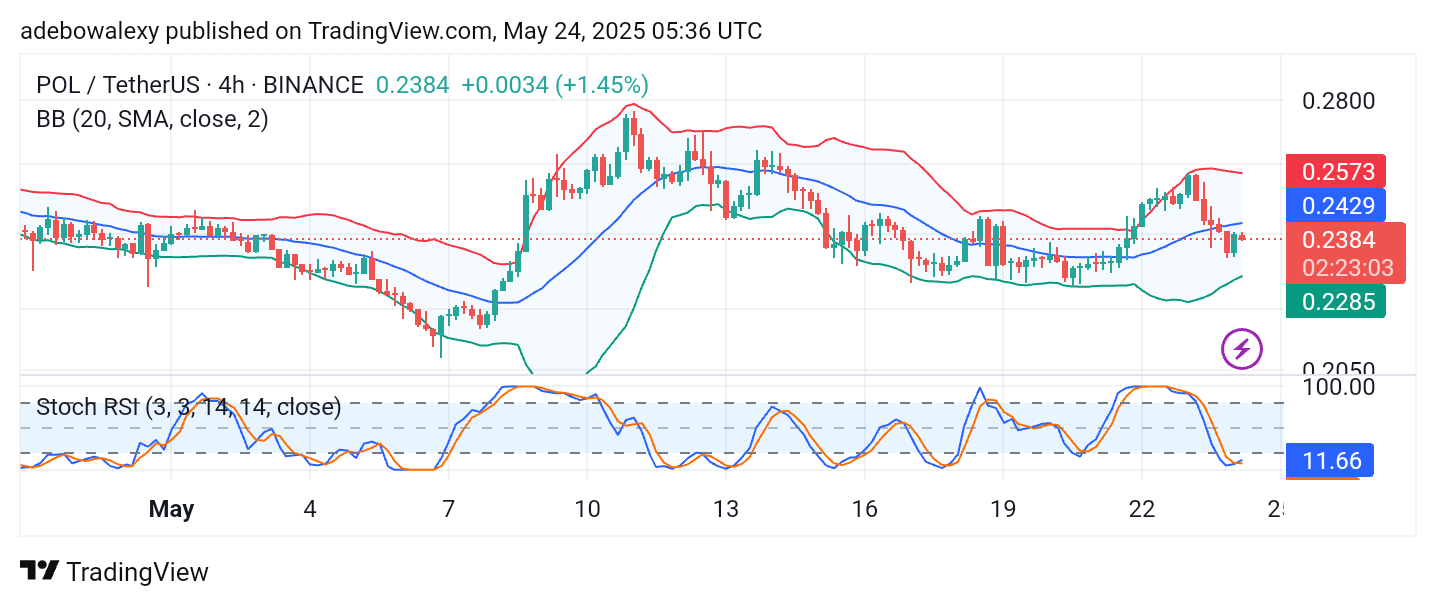
Additionally, the Bollinger Bands indicator remains projected upward. Furthermore, the Stochastic RSI lines have just formed an upward crossover within the oversold region and remain projected upward. Consequently, the market may still have room to progress upward. Should price action climb back above the middle Bollinger Band, we may see the market advance toward the $0.2800 price level.