Solana (SOL) Price Prediction: SOL/USDT Stays Bullish
Estimated Reading Time: 3 minutes
Don’t invest unless you’re prepared to lose all the money you invest. This is a high-risk investment and you are unlikely to be protected if something goes wrong. Take 2 minutes to learn more

Date: May 22, 2025
The Solana market has been recovering ever since price action began gaining bullish momentum. As a result, SOL now trades above the $170 price level, showing potential to climb even higher.
SOL/USDT Long-Term Trend: Bullish (Daily Chart)
Key Price Levels:
Resistance: $190, $200, $220
Support: $170, $150, $140
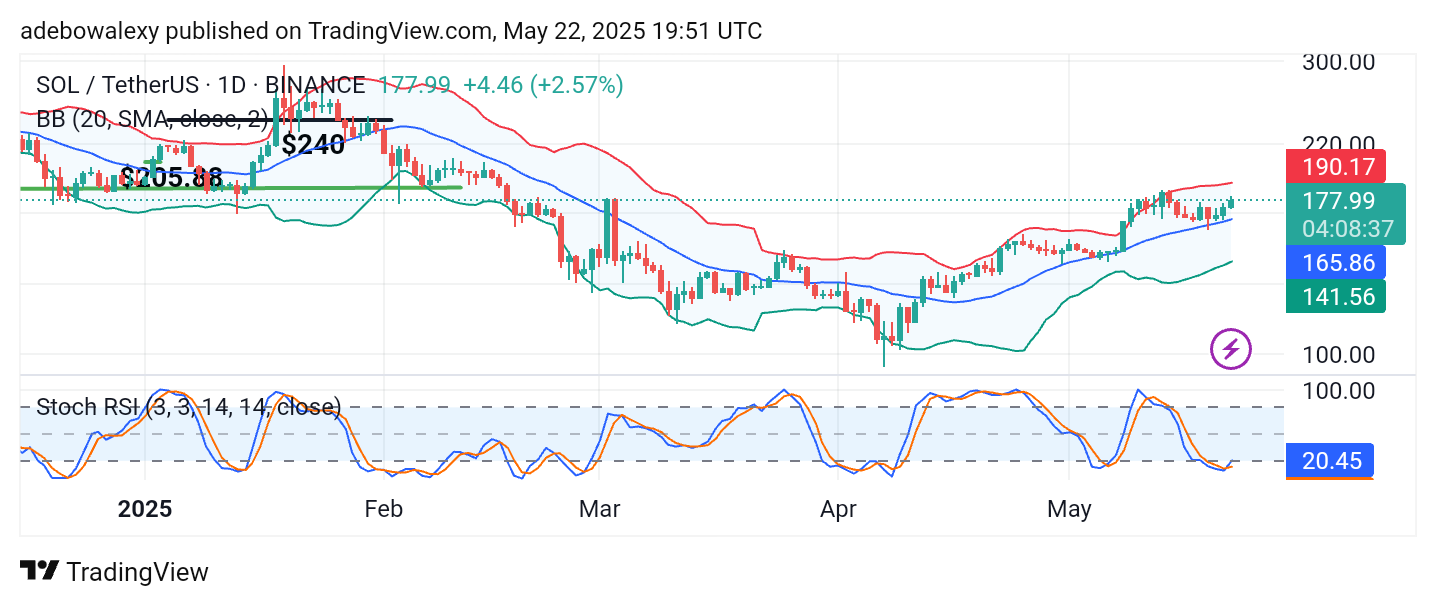
Price activity in the Solana market has rebounded off the support formed by the middle band of the Bollinger Bands. This upward rebound began over the past two sessions.
Additionally, the most recent candlestick remains green and has a significantly larger body, suggesting growing bullish momentum. The Bollinger Bands are slightly angled upward, indicating that bullish momentum continues to dominate.
The Stochastic Relative Strength Index (Stochastic RSI) indicator shows an upward crossover in the oversold region. The lines are now trending upward, signaling a continued upward retracement in this market.
Solana (SOL) Price Prediction: SOL/USDT Stays on Track Towards $180
The price action on the Solana daily chart has maintained an upward trajectory over the past two sessions. As previously mentioned, the most recent candlesticks have grown larger, reflecting increased momentum as trading activity intensifies.
The token is trading above the middle band of the Bollinger Bands, with the Bollinger Bands indicator itself still projected upward—highlighting the overall bullish trend. Similarly, the Stochastic RSI has just completed an upward crossover in the oversold region. At this point, price action appears tilted toward higher levels.
Solana (SOL) Price Prediction: SOL/USDT Encounters Resistance
On the Solana 4-hour chart, price action has shown a minimal downward rebound from the psychological resistance at the $180 level. However, the Bollinger Bands still maintain an upward slope, particularly at their terminal ends. Meanwhile, the Stochastic RSI lines have smoothly turned down from the 100 mark.
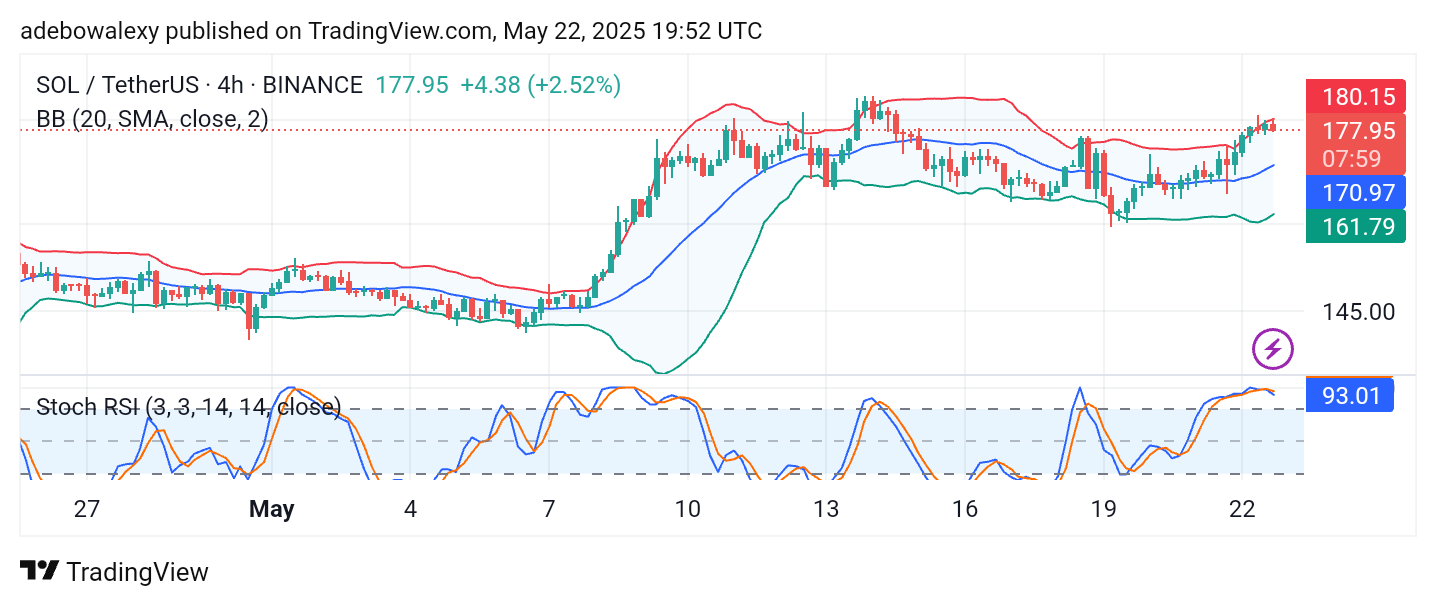
The terminal of this indicator now points downward, reflecting a short-term price pullback. Despite this, the overall trend still appears bullish. Traders may want to lean on technical indications from the daily chart. Consequently, price action seems poised to breach the resistance at $180 and potentially advance toward the $200 price level.