$SPONGE (SPONGE/USD) Soars from $0.00003 to Beyond $0.000045 in a Remarkable Rally
Estimated Reading Time: 3 minutes
Don’t invest unless you’re prepared to lose all the money you invest. This is a high-risk investment and you are unlikely to be protected if something goes wrong. Take 2 minutes to learn more

The $SPONGE (SPONGE/USD) market has experienced a significant surge, breaking free from its consolidation around the $0.00003 price level and climbing past the critical $0.00004 threshold. The bullish momentum pushed prices to a peak of $0.00005 before profit-taking by traders led to a slight pullback, with the price currently hovering around $0.000047. A potential rebound is anticipated if the market corrects further to $0.000045. If this bounce fails to occur, the market is expected to maintain stability above the $0.00004 level.
Key Market Dynamics:
- Resistance Levels: $0.00005, $0.000055, $0.000060
- Support Levels: $0.000020, $0.0000195, $0.000019
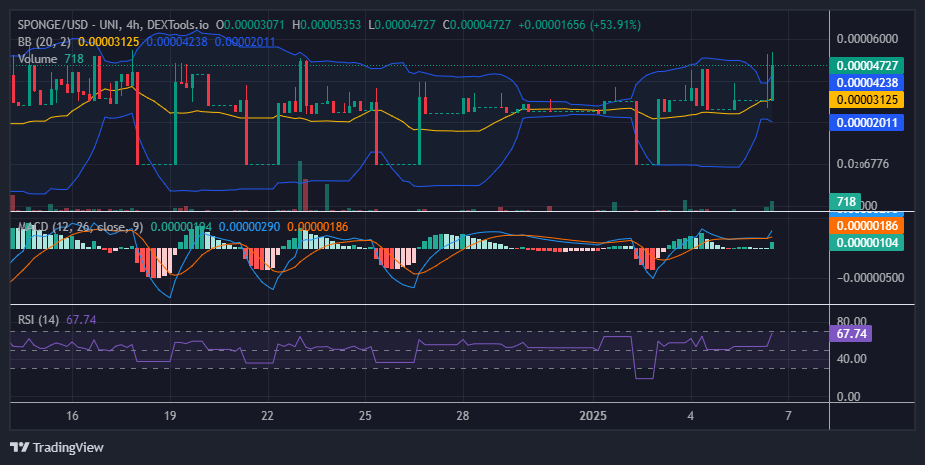
SPONGE/USD Technical Analysis
Maintaining support above $0.00004 could be an early indicator of continued bullish strength. The recent price rally has widened the Bollinger Bands, reflecting heightened volatility. This surge in SPONGE/USD market activity could encourage bearish resistance near critical levels between $0.000045 and $0.00005.
The $0.000040 to $0.000045 range now functions as a higher support zone, while the $0.00003 level remains a solid foundational support. Notably, the 4-hour chart reveals a strong bullish candlestick, a pattern often associated with continued upward momentum. This suggests that bulls may establish a higher support level if corrective pressures persist.
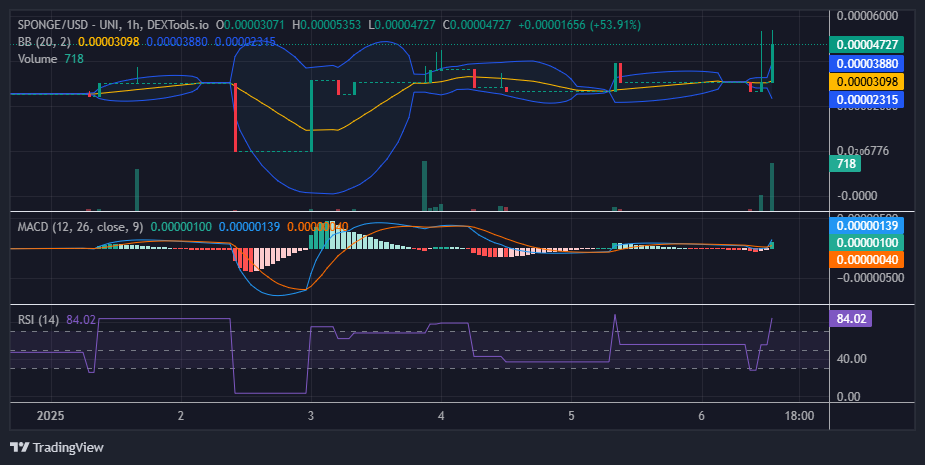
$SPONGE (SPONGE/USD) 1-Hour Chart Observations
The 1-hour chart highlights a sharp bullish breakout, supported by strong trade volume, as evidenced by the histogram. This signals robust buying interest and reinforces the current bullish trend. However, the Relative Strength Index (RSI) reading of 84 indicates that the market is in overbought territory, suggesting the potential for a sharp correction.
In the event of a pullback, traders may seek to reenter bullish positions around the $0.00004 mark, which now serves as a higher support level compared to the previous $0.00003 zone.
Buy $SPONGE!
HAPPY NEW YEAR $SPONGE FAM 🔥
2025 gonna be soooo DAMP 💦💦 pic.twitter.com/Xbd83ptvBp
— $SPONGE (@spongeoneth) January 1, 2025
Join the SPONGE community and be part of the next big crypto sensation! Buy Sponge ($SPONGE) today!