Wall Street Memes (WSM) Trade Retraces, Recouping Rises
Estimated Reading Time: 3 minutes
Don’t invest unless you’re prepared to lose all the money you invest. This is a high-risk investment and you are unlikely to be protected if something goes wrong. Take 2 minutes to learn more
Wall Street Memes Price Prediction – February 21
As for the time being, it is demonstrated that buying efforts that have been exercised in the business activities of Wall Street Memes coin versus the valuation of the US Dollar have been laid to be relaxing, as the crypto retraces movements currently, recouping rises in inputs.
As of this technical analysis, a series of gradual, systemic pullbacks has been forming along the lower Bollinger Band, signaling potential attempts to regain upward momentum. It would be an optimal strategy for buyers to wait for a confirmed breakout before initiating long positions.
WSM/USD Market
Key Levels
Resistance levels: $0.002, $0.0025, $0.003
Support levels: $0.001, $0.0008, $0.0006
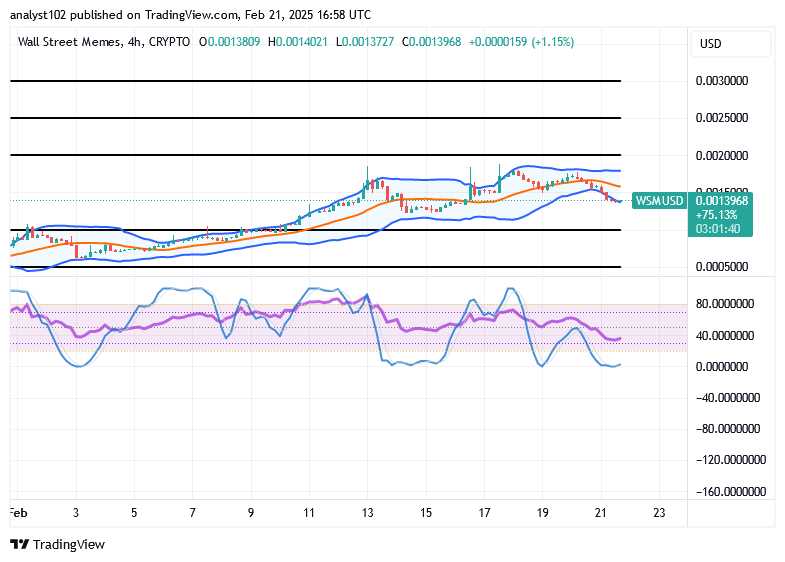
WSM/USD – 4-hour Chart
The medium-term chart (4-hour chart) of the WSM/USD trade retraces below $0.002, recouping rises in inputs.
The candlestick formation, even as it trends downward along the lower Bollinger Band, is predominantly showing lower highs, suggesting that buyers are beginning to establish positions. The stochastic oscillators have consistently moved further into the oversold region, signaling that selling pressure is nearing its conclusion.
Is it reasonable to anticipate that the WSM/USD market pull downs will continue to lengthen throughout the upcoming cycles?
The expectation to see the WSM/USD market operations going more in declines alongside the lower Bollinger Band’s trend line seems not to be putting things in the right perspective technically, given that the base instrument now retraces values, recouping rises in inputs.
As indicated by the setup of most indicators, the momentum for sustained downward price movements is gradually diminishing. Based on this sentiment, it is an opportune time for investors to consider increasing the size of their portfolios.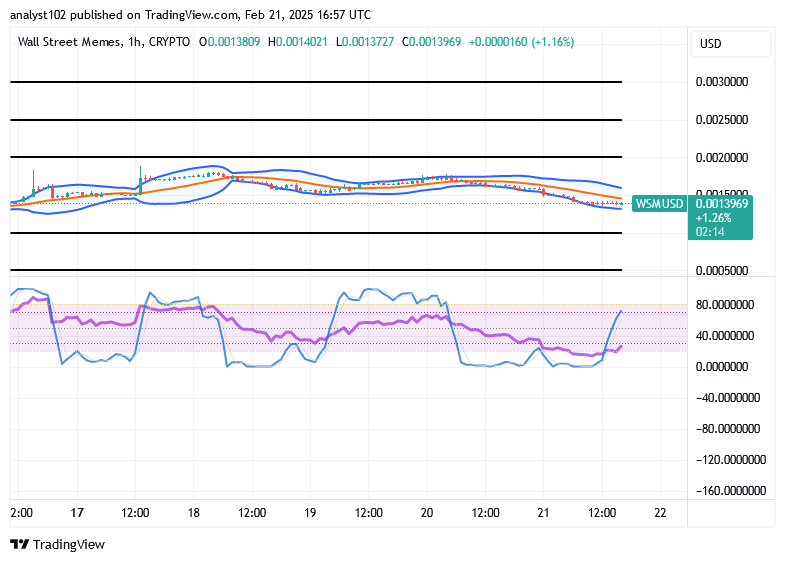
WSM/USD 1-hour chart
The 1-hour chart from the technical picture of the short-term setup shows that the WSM/USD market retraces movements, recouping rises in inputs.
The stochastic oscillators are exhibiting an upward reversal pattern, having shifted from the oversold region. The Bollinger Bands indicators are strategically extended, forming a potential bullish flag pattern. This suggests that long-term investors should consider confirming entry points around the lower trend line of the Bollinger Bands.
Florists responding to a tragedy that claims hundreds of lives in their community.
Florists when a catastrophe kills hundreds of people in their area pic.twitter.com/V1Pab1cF10
— Wall Street Memes (@wallstmemes) February 21, 2025
Buy and stake WSM now!: Wall Street Meme (WSM)