The Orca Market (ORCA/USD) Regains Strength, Bullish Momentum Builds Towards $3.00
Estimated Reading Time: 3 minutes
Don’t invest unless you’re prepared to lose all the money you invest. This is a high-risk investment and you are unlikely to be protected if something goes wrong. Take 2 minutes to learn more

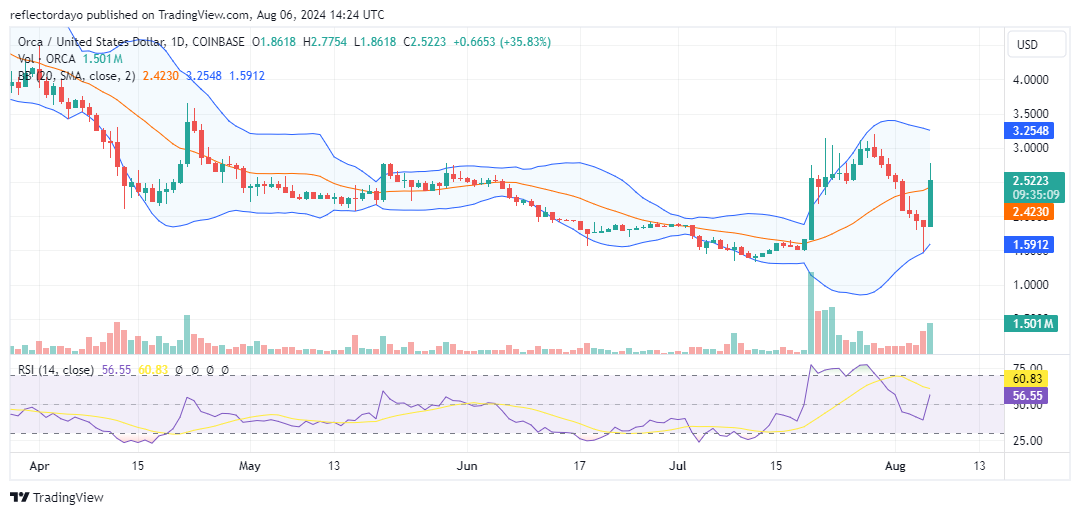
After the remarkable rally in the Orca market in mid-July, which propelled the market out of its consolidation phase to a higher price level, there was a concerted effort to reach and surpass the $3.00 price point. However, a strong resistance emerged at this level. The bullish momentum was repeatedly rebuffed at $3.00 until a bearish trend began to sweep across the crypto market towards the end of July. This downturn threatened to erode all the gains from the previous bull run. Despite this, the early part of yesterday’s trading session saw significant bullish activity, triggering positive sentiment at the $1.50 level—the starting point of the last bull run. This bullish momentum has continued into today.
The Orca Market Data
- ORCA/USD Price Now: $2.516
- ORCA/USD Market Cap: $130 million
- ORCA/USD Circulating Supply: 51 million
- ORCA/USD Total Supply: 100 million
- ORCA/USD CoinMarketCap Ranking: #265
Key Levels
- Resistance: $3.00, $3.50, and $4.0
- Support: $2.20, $2.00, and $1.50.
The Orca Market Through the Lens of Indicators
When it was thought that the gains from the last bull run would be eroded, traders began buying again at the same price level that triggered the previous bullish run. Between yesterday and today, the market has shown aggressive bullish behavior, with the price currently standing slightly above $2.50. Traders might still aim for the $3.00 price target; however, considering the daily chart, a resistance level appears to be emerging around the $2.50 price threshold. Given that the current trading volume supports the ongoing market action, the market may recover from its recent profit-taking activities, which have brought the price down to around $2.50. Traders should note that, according to the Bollinger Bands indicator and the RSI, the market is quite volatile. It would be prudent for investors to wait for the emergence of another candlestick at the $2.50 price level to confirm that the bulls have secured this level.
ORCA/USD Price Prediction: 4-Hour Chart Analysis
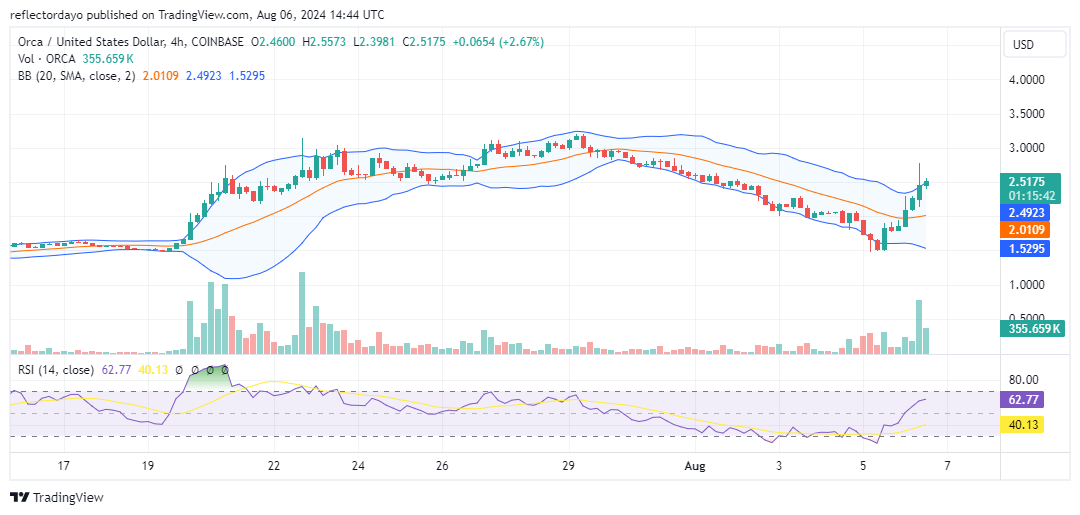
The outlook of the Orca crypto signal, as observed from the 4-hour chart, indicates the early stages of an established bullish recovery trend. Bullish candlesticks have been consistent, surging above the 20-day moving average, with the price poised to surpass the upper standard deviation. However, as the price approaches the $2.50 level, momentum appears to be diminishing due to indecision at the current price point. The market may need to stabilize at this level before its next direction can be determined.