Balancer (BAL/USD) Faces Important Crossroad at $2.65
Estimated Reading Time: 2 minutes
Don’t invest unless you’re prepared to lose all the money you invest. This is a high-risk investment and you are unlikely to be protected if something goes wrong. Take 2 minutes to learn more
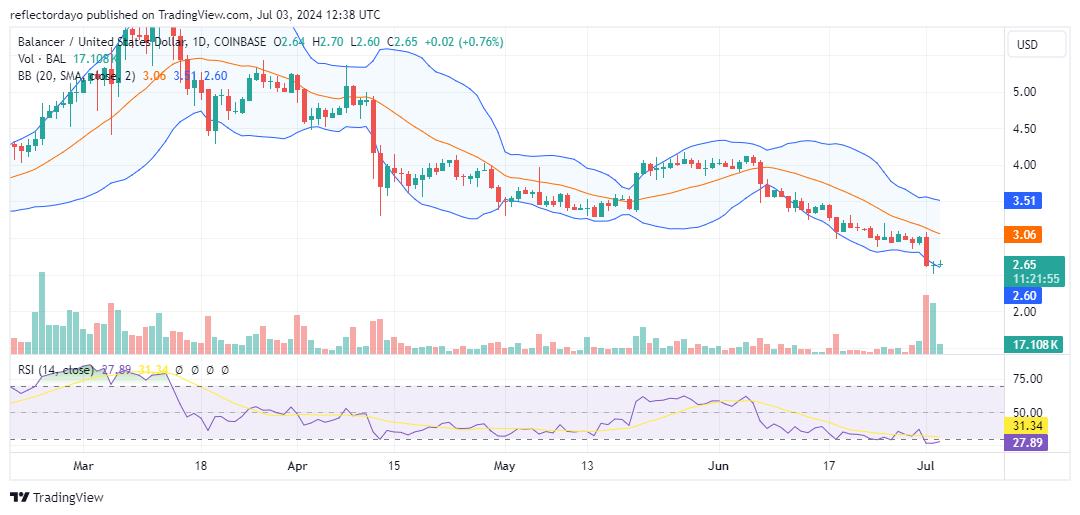
The Balancer market had already been in a downtrend before the significant selloff reflected on the daily chart on July 1. Prior to this decline, a support level emerged at $3.00, following a decrease from $4.00 to $3.00 on June 23. The market ranged along this newly established support level for a week before the breakdown. The breach of this support level likely contributed to increased bearish sentiment, leading to a substantial selloff.
Balancer Market Data
- BAL/USD Price Now: $2.65
- BAL/USD Market Cap: $152 million
- BAL/USD Circulating Supply: 58 million
- BAL/USD Total Supply: 64 million
- BAL/USD CoinMarketCap Ranking: #270
Key Levels
- Resistance: $3.20, $3.40, and $3.50
- Support: $2.50, $2.20, and $2.00.
Balancer Market Through the Lens of Indicators
At the beginning of July, the market experienced a significant decline from $3.00 to approximately $2.62, signaling a bearish trend. The market now seems to be at a crossroads, with uncertainty about whether it will rally or continue the downtrend. However, an analysis of indicators suggests that the bearish trend may not persist, potentially leading to a bullish recovery that could push prices above $3.50.
Examining the Relative Strength Index (RSI), we observe the RSI line hovering below the oversold level of 30, indicating that the market may not remain bearish for long and a price correction is anticipated. Additionally, the formation of two plus sign dojis at the end of the trend signifies a possible bullish reversal.
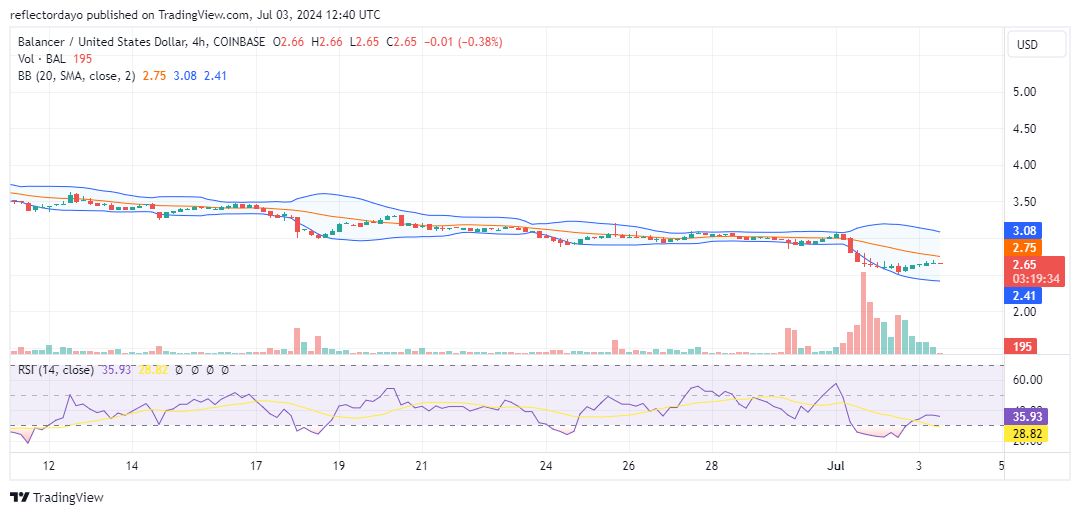
BAL/USD Price Prediction: 4-Hour Chart Analysis
The 4-hour chart indicates that the market has started to bounce upward. However, the rally is encountering bearish pressure prematurely, causing the price to stall in the current 4-hour trading session. The market may consolidate at this newly established price level before determining its next direction. Investors should monitor key crypto signals that could indicate the market’s future trajectory.