Celestia (TIA/USD): Bearish Momentum Pauses, Seeking a Pivot Point
Estimated Reading Time: 3 minutes
Don’t invest unless you’re prepared to lose all the money you invest. This is a high-risk investment and you are unlikely to be protected if something goes wrong. Take 2 minutes to learn more

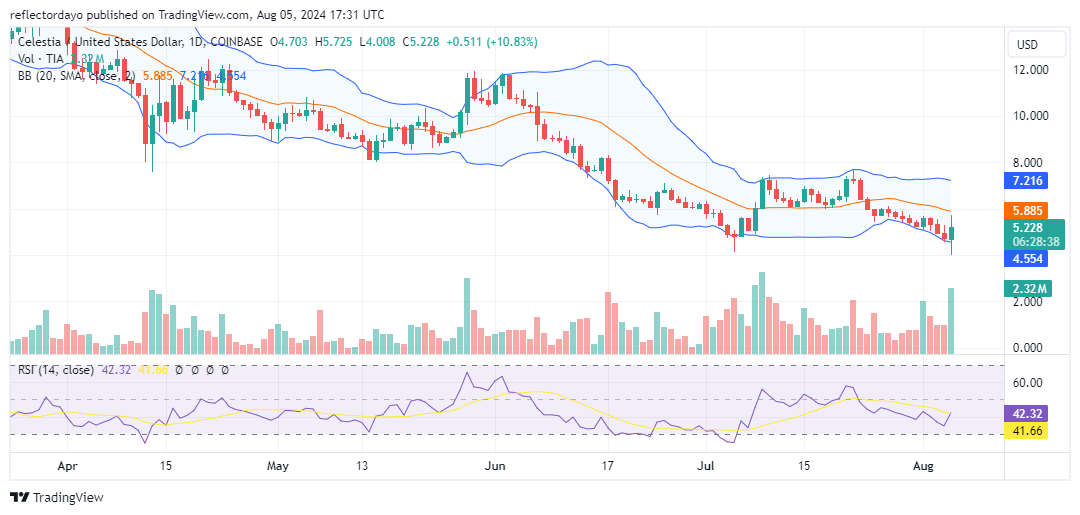
From a broad perspective, the market can be described as consolidating, characterized by a rectangular price pattern. The price of Celestia has fluctuated within the $4.78 to $7.279 range. However, towards the end of July, the price, starting from around $5.81, began to trend downwards consistently. This downward trend continued into the beginning of this month, with the bear market gaining momentum, creating the impression that the market might experience further declines. Nonetheless, upon reaching a key support level, the bearish movement appeared to halt, preventing the price from falling further.
Celestia Market Data
- TIA/USD Price Now: $5.182
- TIA/USD Market Cap: $1 billion
- TIA/USD Circulating Supply: 202 million
- TIA/USD Total Supply: 1.1 million
- TIA/USD CoinMarketCap Ranking: #56
Key Levels
- Resistance: $6.00, $6.50, and $7.00
- Support: $4.50, $4.00, and $3.50.
Celestia Market Through the Lens of Indicators
Yesterday, the market reached a key support level around the $4.70 price point. The candlestick representing yesterday’s trading session suggested an impending bearish momentum in the near term. This type of candlestick, known as an inverted hammer, has a substantial upper shadow and no lower shadow. The crypto signal from yesterday met expectations, as the early period of today’s trading session was initially dominated by bears. The Celestia price dropped as low as the $4.00 threshold, but sellers could not sustain the bearish trend and eventually yielded to bullish pressure, causing the price to rebound and recover lost ground. The volume indicator shows significant activity, indicating a fierce struggle for market control between demand and supply. Currently, the market appears to be stabilizing at equilibrium near the key support level.
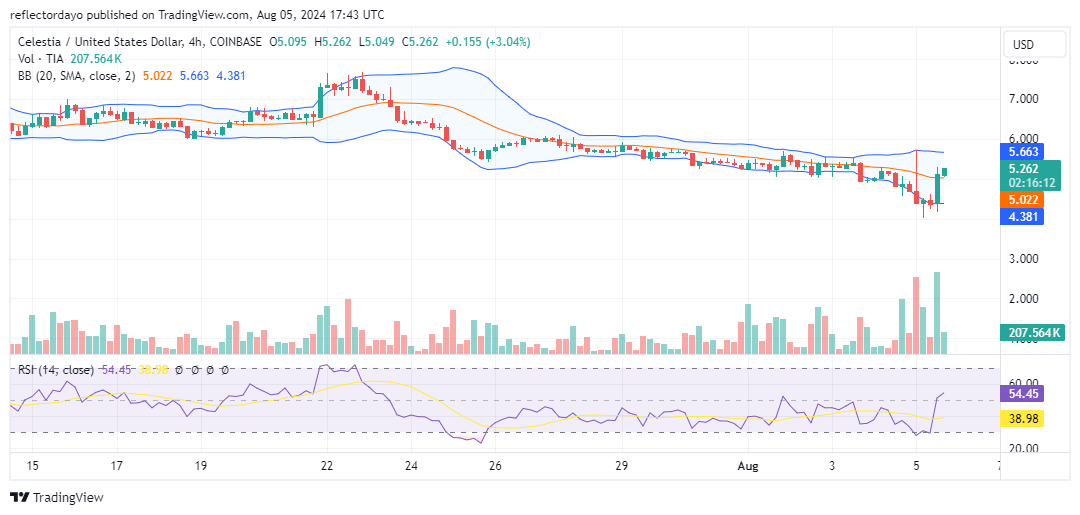
TIA/USD Price Prediction: 4-Hour Chart Analysis
The initial bearish run today impacted the Bollinger Bands slightly. While the lower standard deviation began to diverge downward, the upper standard deviation remained unaffected by the market movement, causing traders to exercise caution. However, this brief market dip created an opportunity for bullish traders to enter the market, leading to a recovery surge. The market remains largely in a consolidation phase, maintaining its stable price channel. However, if the market forms a lower high, it may indicate the beginning of a bearish trend.