dYdX (DYDXUSD) Oscillates Within the $2.234 and $3.043 Horizontal Price Channel
Estimated Reading Time: 2 minutes
Don’t invest unless you’re prepared to lose all the money you invest. This is a high-risk investment and you are unlikely to be protected if something goes wrong. Take 2 minutes to learn more
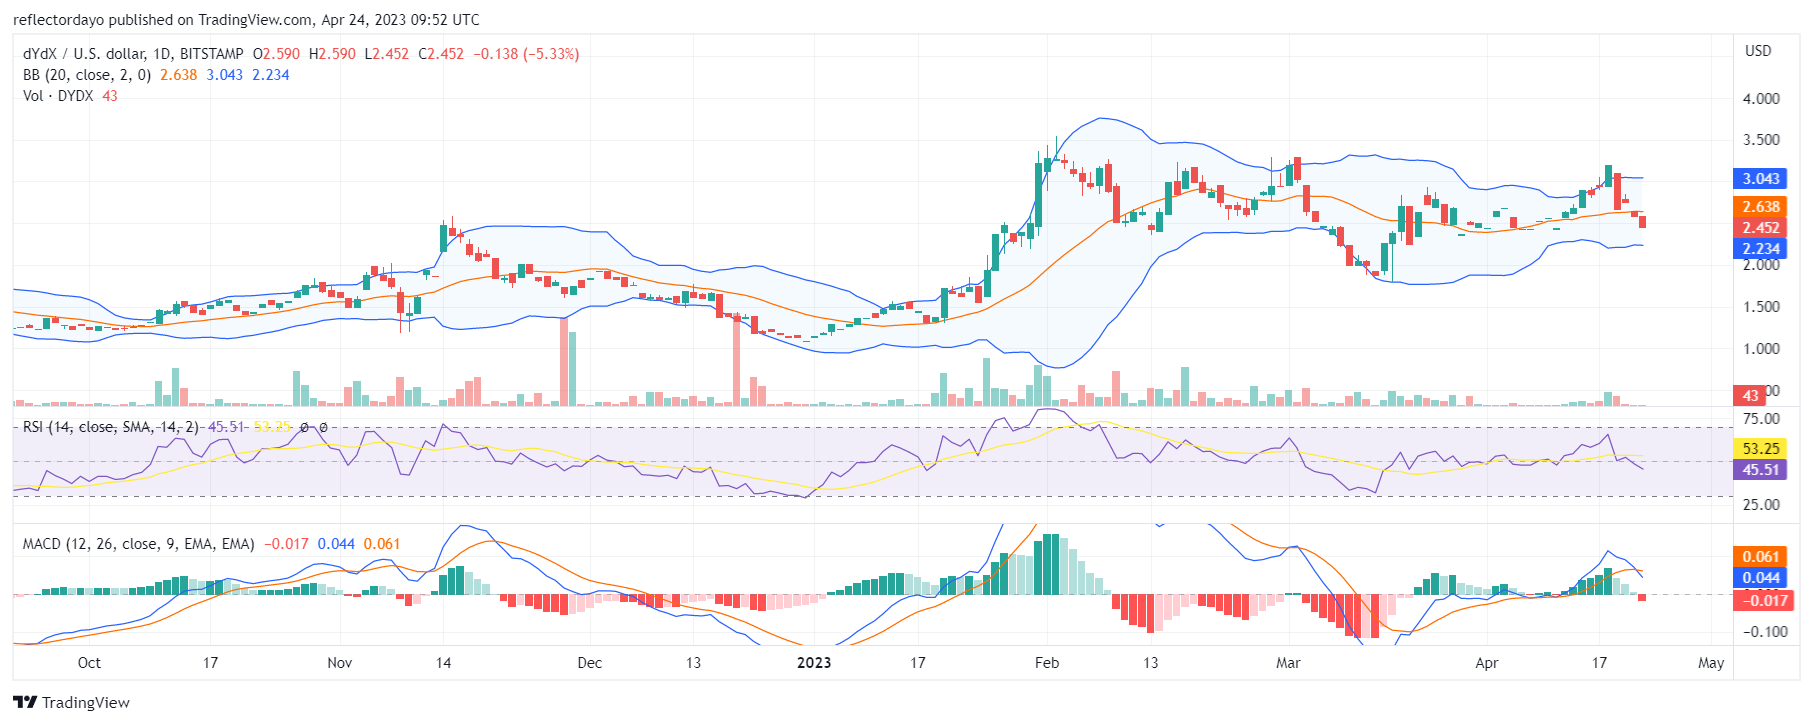
The dYdX market faced a massive decline in early March. However, the bear market did not go too far with the price before the bulls cut them off at the $1.875 price level. At this level, the price was restored to the $2.50 price zone. But for a period of, like, almost two weeks, the dYdX market oscillated around the $2.50 price level. Some of the daily sessions around this time indicate a complete standoff between buyers and sellers. The market picked up again in the second half of April, with bullish actions.
DYDX/USD Price Statistics
- DYDX/USD Price Now: $2.452
- DYDX/USD Market Cap: $383,089,800
- DYDX/USD Circulating Supply: 156,256,174 DYDX
- DYDX/USD Total Supply: 1,000,000,000
- DYDX/USD CoinMarketCap Ranking: #97
Key Levels
- Resistance: $3.500, $4.00, and $4.50
- Support: $2.00, $1.50, and $1.00
Price Prediction for dYdX: Market Oscillating Within the Horizontal Price Channel
The bull market hit a brick wall at $3.238 on April 18, and currently, the price has fallen below the 20-day moving average. Lately, as the market oscillates (or swings) around the $2.50 price level, the price seems to be continuously bouncing back at the $2.429 support level. Currently, the price of the market is nearing this level, and it will likely bounce off from here. While the Relative Strength Index points to a weak sell signal, the Moving Average Convergence and Divergence (MACD) points to a declining buy signal as its indicating lines are still above level zero.
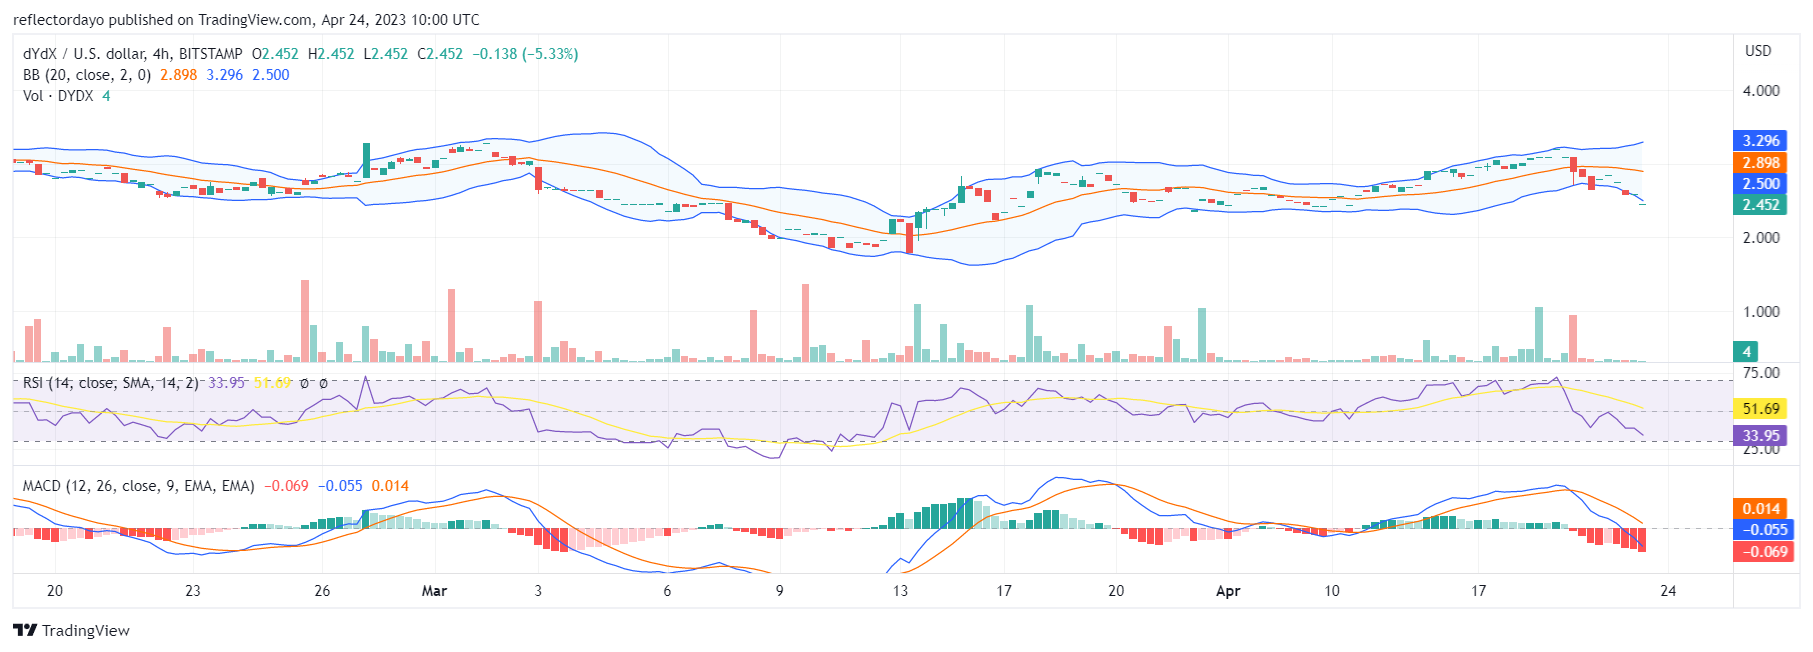
DYDX/USD 4-Hour Chart Outlook:
From this standpoint, we can see that most of the 4-hour trading session is characterized by the frequent appearance of four-price Dojis. This is a sign of a lack of interest in demand or supply. However, at some point, we notice some spikes in both the bull market and the bear market. It is more like the bulls and bears are responsive to each other. Currently, the price has settled on the support level; the next place to face is the upside.