Zcash (ZEC/USD) Market Update: Spring Recovery Stalls at Critical $40 Resistance
Estimated Reading Time: 3 minutes
Don’t invest unless you’re prepared to lose all the money you invest. This is a high-risk investment and you are unlikely to be protected if something goes wrong. Take 2 minutes to learn more
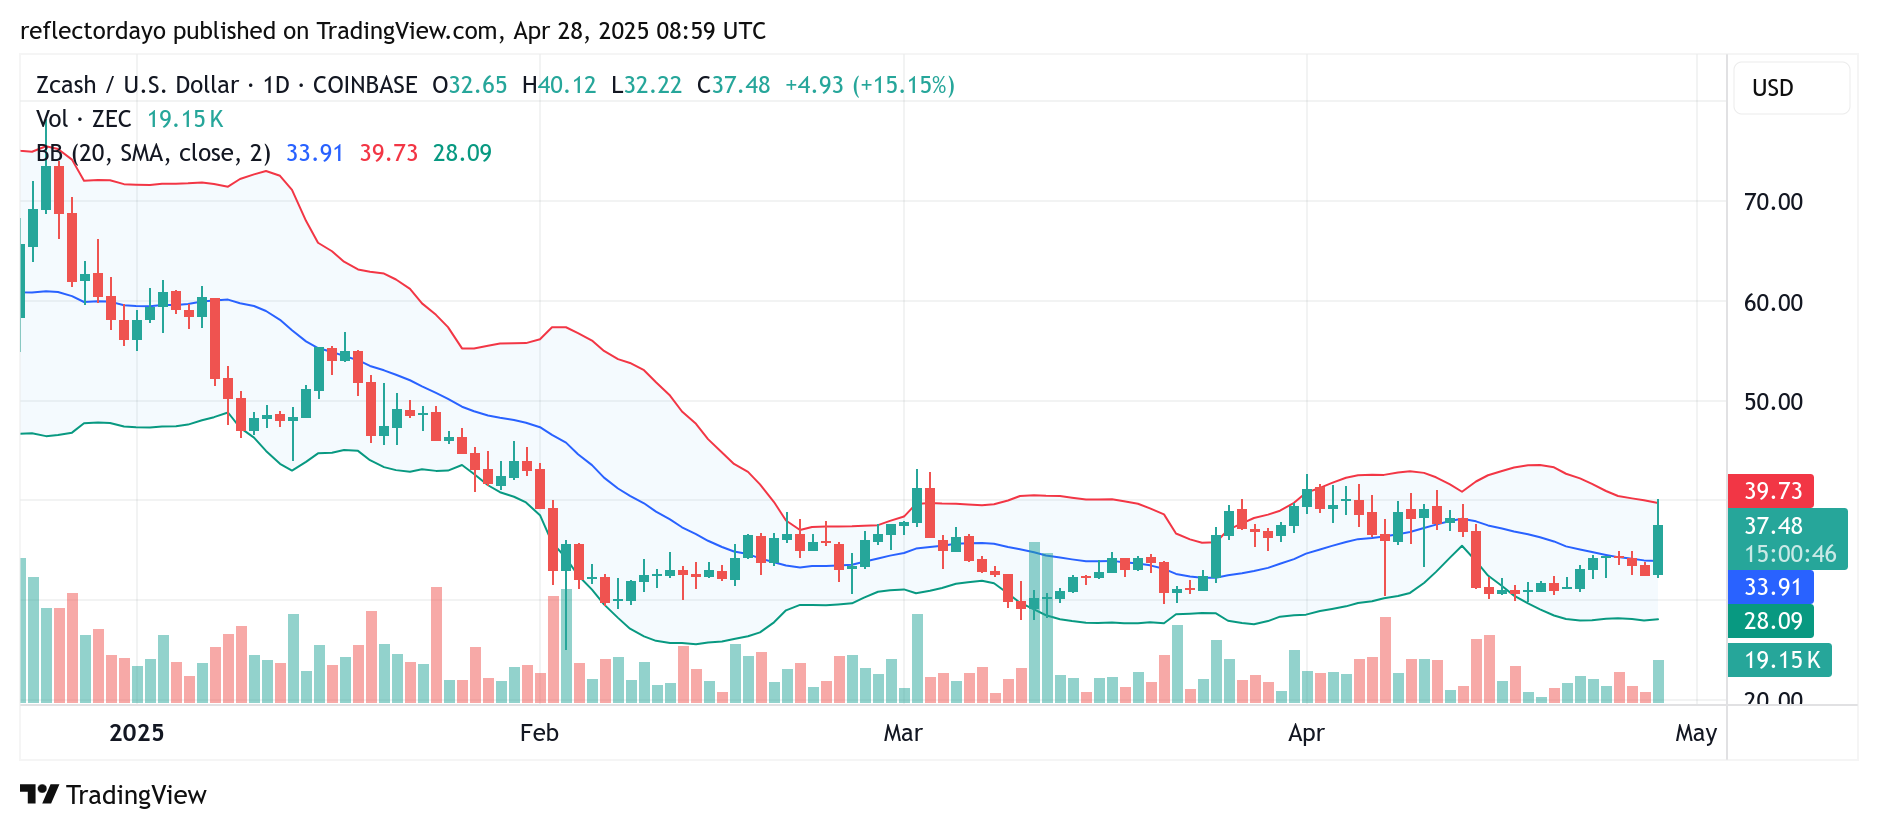
After a period of consolidation around the $30 level, Zcash (ZEC/USD) staged a decisive rally, with the price climbing toward the key $40 resistance zone.
Today’s trading session saw a strong surge fueled by a wave of bullish sentiment and increased market liquidity. However, despite the aggressive upward move, the bulls struggled to break through the $40 barrier, facing swift rejection at that level. Signs of bullish exhaustion may have contributed to the failure to sustain momentum above this critical threshold.
Zcash Market Data
- ZEC/USD Price Now: $37.5
- ZEC/USD Market Cap: $589 million
- ZEC/USD Circulating Supply: 15.9 million
- ZEC/USD Total Supply: 15.9 million
- ZEC/USD CoinMarketCap Ranking: #103
Key Levels
- Resistance: $40, $50 and $60
- Support: $30, $20, and $15
Zcash (ZEC/USD) Technical Analysis: Bulls Maintain Pressure Despite Rejection at $40
The Zcash (ZEC/USD) market faced a swift rejection at the $40 resistance level, a common reaction following a strong bullish rally, as traders often move to secure profits at major price milestones.
Despite the setback, the bulls continue to maintain significant control over the market. Analysis of the chart reveals that the Bollinger Bands remain wide, indicating elevated volatility, while the strong trade volume supports the ongoing bullish momentum. This crypto signal suggests that bullish interest remains robust.
If the price can stabilize at current levels, the $40 resistance could come under renewed pressure, potentially giving way to further upward movement.

Zcash (ZEC/USD) 4-Hour Chart Analysis: Bulls Eye $40 Resistance Amid Volatility
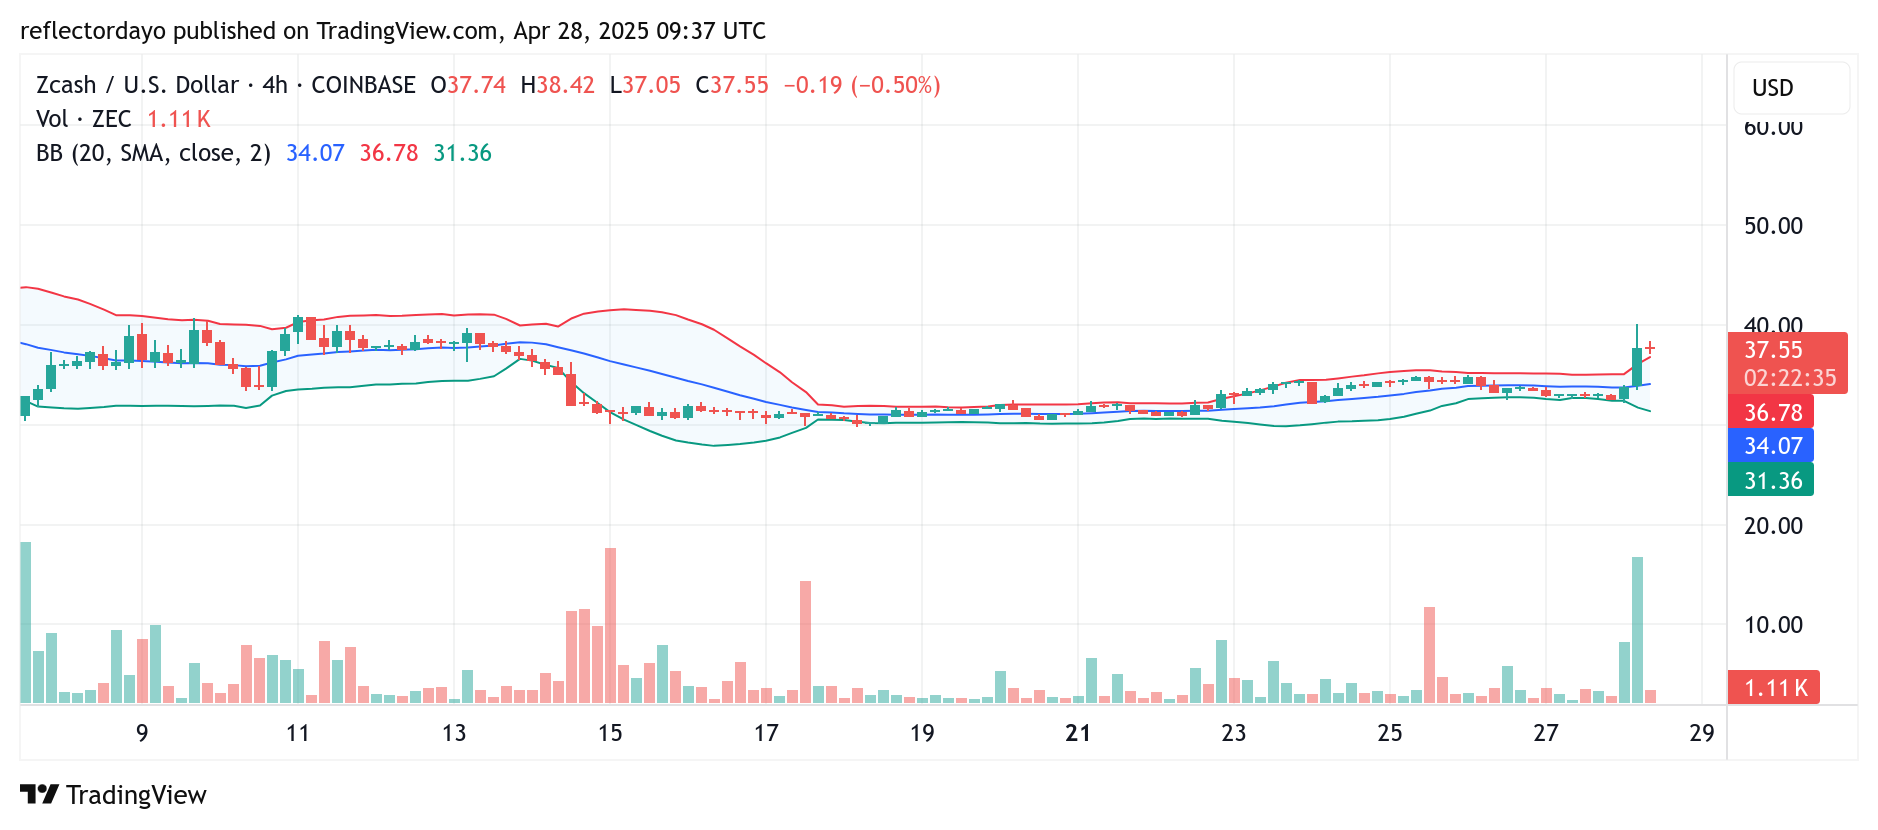
Zooming into the 4-hour chart, we observe that buyers and sellers are currently in a standoff around the $37.5 level, which is closely positioned near the critical $40 resistance zone. This suggests that if support holds at the current level, the $40 resistance could come under increased bullish pressure.
The current trading session displays a plus-sign doji, indicating a balance between demand and supply. However, given the heightened market volatility — and particularly since this doji is forming outside the upper boundary of the Bollinger Bands — sustaining a stable support level here may prove challenging. As is often the case when markets become overbought, a corrective move could pull the price back within the bands. Nevertheless, if bullish momentum persists, a breakout above the $40 resistance remains a strong possibility.