Dogwifhat (WIF/USD) Converts $0.55 Into Support — Can the Momentum Hold?
Estimated Reading Time: 3 minutes
Don’t invest unless you’re prepared to lose all the money you invest. This is a high-risk investment and you are unlikely to be protected if something goes wrong. Take 2 minutes to learn more

In today’s trading session, Dogwifhat (WIF/USD) demonstrated a strong bullish push, marked by a significant increase in market liquidity. A surge in buying interest drove the price upward, building on previous momentum that had already established $0.40 as a solid support level.
This bullish breakout propelled WIF beyond the $0.50 resistance, and today, traders aggressively entered the market at the $0.55 mark — a level that acted as resistance in the previous session. The fact that $0.55 is now being tested as support suggests a potential shift in market structure and growing bullish conviction.
The key question now is whether this upward momentum can be sustained or if the market will face exhaustion in the short term.
Dogwifhat Market Data
- WIF/USD Price Now: $0.628
- WIF/USD Market Cap: $625 million
- WIF/USD Circulating Supply: 998 million WIF
- WIF/USD Total Supply: 998 million WIF
- WIF/USD CoinMarketCap Ranking: #98
Key Levels
- Resistance: $0.70, $0.75 and $0.80
- Support: $0.55, $0.50, and $0.45
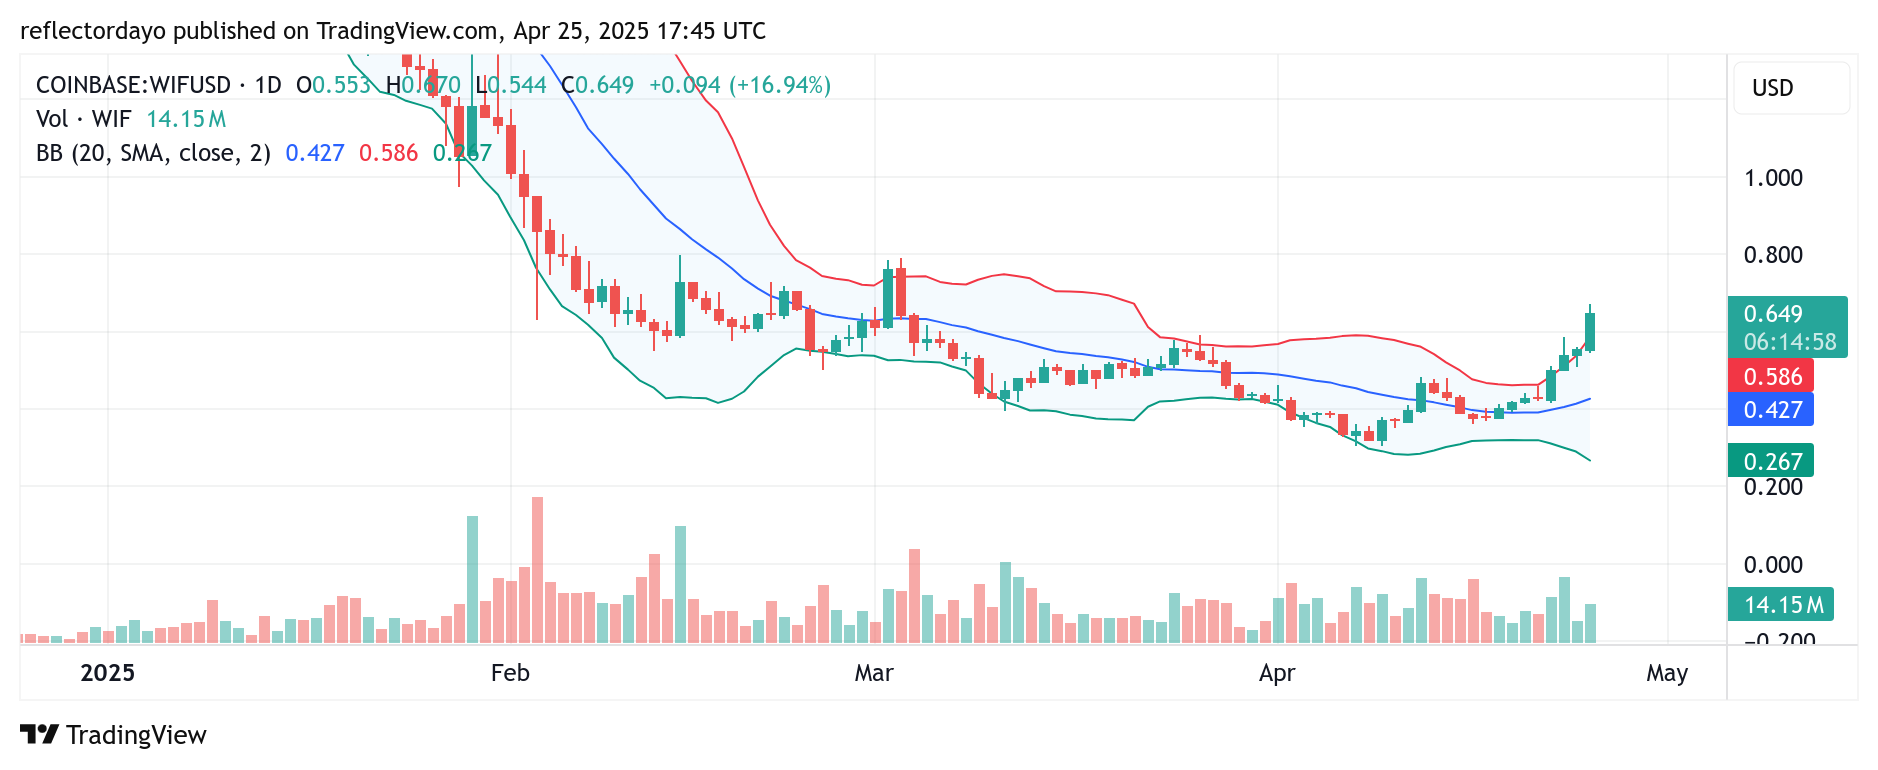
WIF/USD Technical Analysis: Bulls Take Charge as Price Eyes $0.70, but Caution Signals Emerge
In today’s trading session, Dogwifhat witnessed a strong bullish surge, successfully flipping the $0.55 level into a higher support zone. This breakout marks a significant milestone for buyers, as the move generated increased positive sentiment and pushed the price further toward the $0.70 target.
The current price action reflects clear bullish dominance. However, the appearance of an upper wick on today’s daily candlestick suggests that some traders may be locking in profits — potentially in response to signs of overbought conditions. This concern is supported by the price extending beyond the upper Bollinger Band, signaling a possible short-term exhaustion.
With the Bollinger Bands showing divergence, a brief correction may be imminent. Should this occur, key retracement levels to watch include $0.60 and, more conservatively, $0.55. A bounce from either of these levels would further reinforce the market’s bullish structure and strengthen the case for continued upward movement.
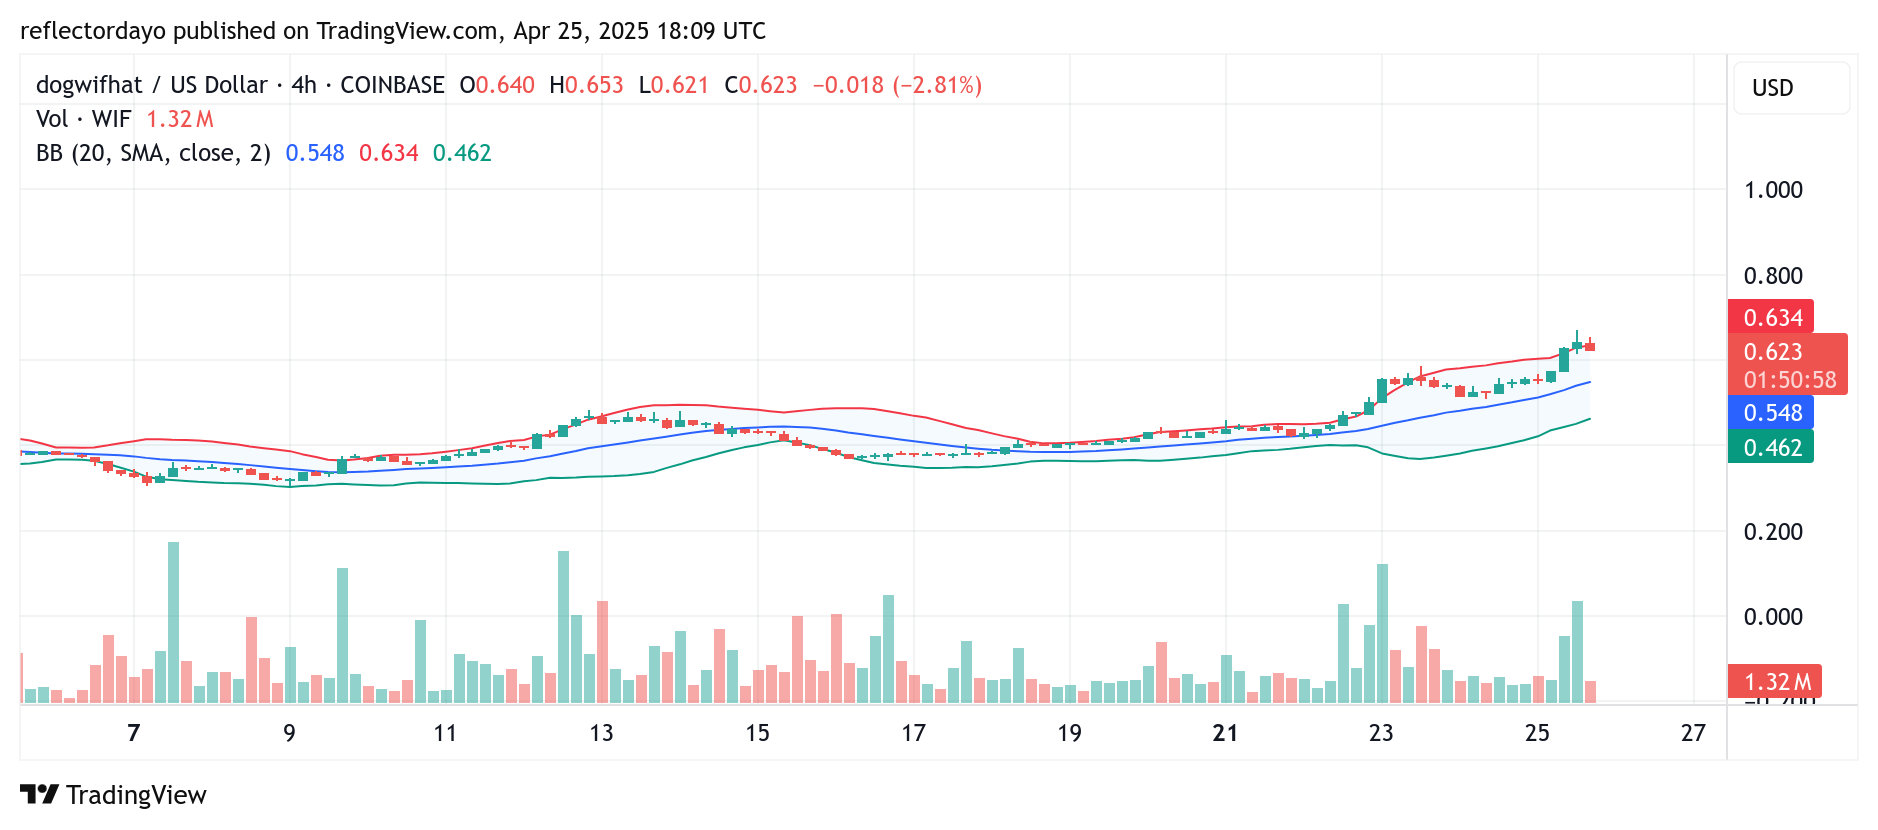
WIF/USD 4-Hour Chart Outlook: $0.60 Emerges as Key Support Amid Ongoing Uptrend
The bullish momentum in WIF/USD is clearly reflected on the 4-hour chart, where the uptrend is well-defined — a trend reinforced by the expanding structure of the Bollinger Bands. As the market enters a corrective phase, the $0.60 level is increasingly showing signs of establishing itself as a meaningful support zone.
Recent price action has revealed early rejection of bearish attempts around the $0.60 mark, suggesting that buyers are beginning to defend this level. If this behavior continues, it could pave the way for either a breakout continuation or a period of consolidation.
Traders should closely monitor this zone, as it may serve as a launching pad for the next leg upward or act as a base for sideways price movement before the next directional push.