$SPONGE (SPONGE/USD) Continues to Hold Ground Above $0.00045
Estimated Reading Time: 3 minutes
Don’t invest unless you’re prepared to lose all the money you invest. This is a high-risk investment and you are unlikely to be protected if something goes wrong. Take 2 minutes to learn more
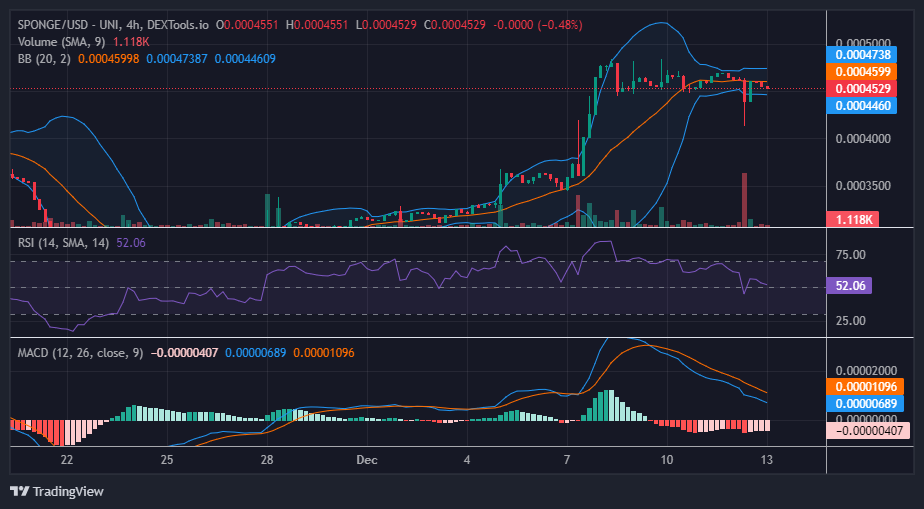
The $SPONGE market has recently experienced a notable surge in bullish activities, signaling robust momentum that anticipates a response from the bearish side of the market. In just four trading sessions, the price rose from approximately $0.00036 to surpass the $0.00045 level. The initial anticipation was that traders would capitalize on this surge to secure substantial profits. Contrary to these expectations, a noteworthy bearish price movement occurred. Nevertheless, bulls intervened around the $0.00045 mark, leading to a market consolidation phase.
Key Price Levels:
- Resistance: $0.00047, $0.00050, and $0.00060.
- Support: $0.000350, $0.00030, and $0.00025.
In-Depth Technical Analysis for $SPONGE (SPONGE/USD) Price Movement:
As consolidation persists above the $0.00045 price level, the volatility is gradually subsiding, leading to the convergence of the Bollinger Bands indicator into a narrow channel. However, during the last daily session, the $SPONGE bear market experienced an upswing in bearish sentiment, reflected in a significant increase in the volume of trade indicator with a notably tall histogram. Despite this, the bearish trend became unsustainable below the critical price level as the bulls intervened, resulting in the formation of a hammer candlestick—a bullish signal. The resurgence of bullish activities has reinstated the market to the $0.00045 price level, and the market currently maintains a sideways range.
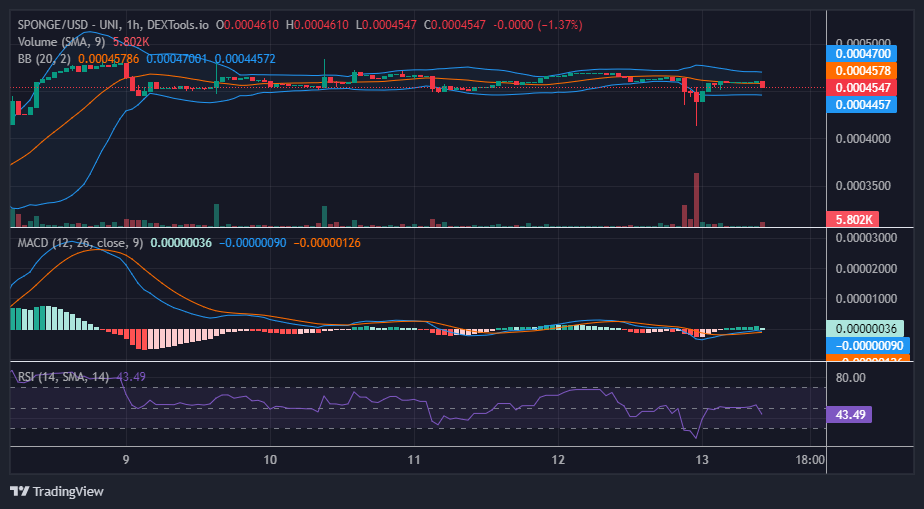
Insights from the Short-Term 1-Hour Chart:
In the 1-hour chart analysis, a dynamic interplay between demand and supply is evident, resembling a tug-of-war scenario. Recent trader sentiment has leaned toward bearish expectations, anticipating a market reversal following the $0.00045 price mark. A pronounced bearish movement unfolded, yet the trend became unsustainable below the $0.00045 level as bulls intervened. Notably, two hammer candlesticks emerged, signaling a potential bullish reversal.
Subsequent to the price rally, the bullish momentum encountered resistance at $0.00046, leading to a consolidation phase with bulls and bears currently in a deadlock. The ongoing consolidation suggests a potential continuation of the bullish trend in the subsequent market movement.
Buy SPONGE/USD!
Fun times 🙏👑#NFT $SPONGE #MemeCoin #Trade pic.twitter.com/iI1nw2IWfc
— $SPONGE (@spongeoneth) December 12, 2023
Invest in the hottest and best meme coin. Buy Sponge ($SPONGE) today!