Litecoin (LTC/USD) Price Is in Correction, Opting for a Rally
Estimated Reading Time: 3 minutes
Don’t invest unless you’re prepared to lose all the money you invest. This is a high-risk investment and you are unlikely to be protected if something goes wrong. Take 2 minutes to learn more
Litecoin Price Prediction – November 21
There has been a persistent level of financial situation showcasing that bulls in LTC/USD trade activities have been slowing down forces against bears over the past couple of days, given the crypto-economic price is in correction, opting for a rally.
The declining motion is making a short, slanting path across the trend line of the middle Bollinger Band. The lower part of the indicators has also moved somewhat, indicating that buyers may be attempting to regain positions over $65. Therefore, it would be a beneficial buying technique for long-position pushers to continue increasing their holdings.
LTC/USD Market
Key Levels:
Resistance levels: $75, $80, $85
Support levels:$65, $60, $55
LTC/USD – Daily Chart
The LTC/USD daily chart showcases that the crypto-economic price is in correction, opting for a rally.
The Bollinger Bands’ trend lines show a small easterly curvature just above the $75 resistance line, while the bottom portion is almost above the $65, which serves as support. Over the past few days, a series of smaller bounce inputs from the bottom side of the Bollinger Band have been observed in the candlestick formation pattern. The blue line of the stochastic oscillators has slipped into the oversold area and touched zero. This suggests that the quotient instrument tends to become lighter quickly.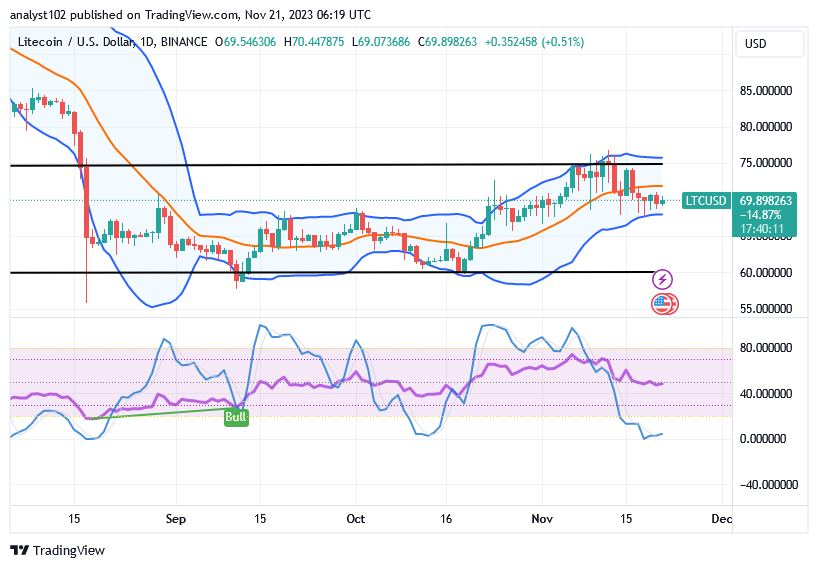
Will the lower Bollinger Band’s collapse validate the expectation of additional lows in the ensuing LTC/USD trade operations?
A delay in the way bulls in the LTC/USD market operate could cause further slow motions with no decent entries to play alongside, as the crypto-economic price is in correction, opting for a rally.
Examining a potential resurgence of rebel forces inside the cryptocurrency market, it is increasingly evident that long-position placers may be gathering strength between the middle and lower Bollinger band points. If investors were to profit from the long-term running style, then patience would be a crucial strategy.
Bears in the LTC/USD trade would need to hold off on joining the move for a time, as it has been shown to do. That feeling has its roots in the fact that the velocity pace has been somewhat depleted. We advise that shorting positions be suspended in light of it.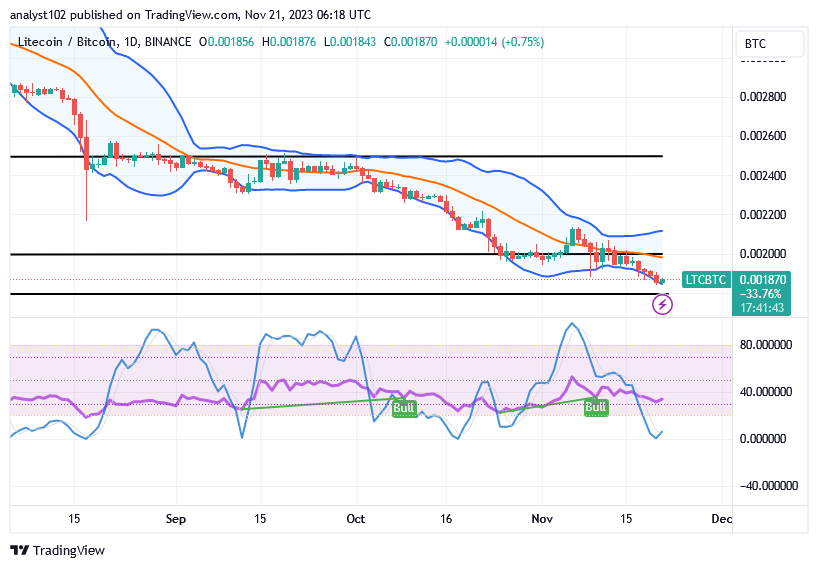
LTC/BTC Price Analysis
In contrast, the Litecoin market is in an intense correction motion against the weight of Bitcoin, opting for a rally around the lower Bollinger Band trend line.
With a small curve index, the stochastic oscillators have entered the oversold area, indicating that the base cryptocurrency will soon be able to rise again against the counter-trading instrument’s valuation. To indicate that declining trends are about to fade, the Bollinger Band trend lines swerve when their indicators open. As a result, investors had to make an effort to obtain positions.
Note: Cryptosignals.org is not a financial advisor. Do your research before investing your funds in any financial asset or presented product or event. We are not responsible for your investing results.
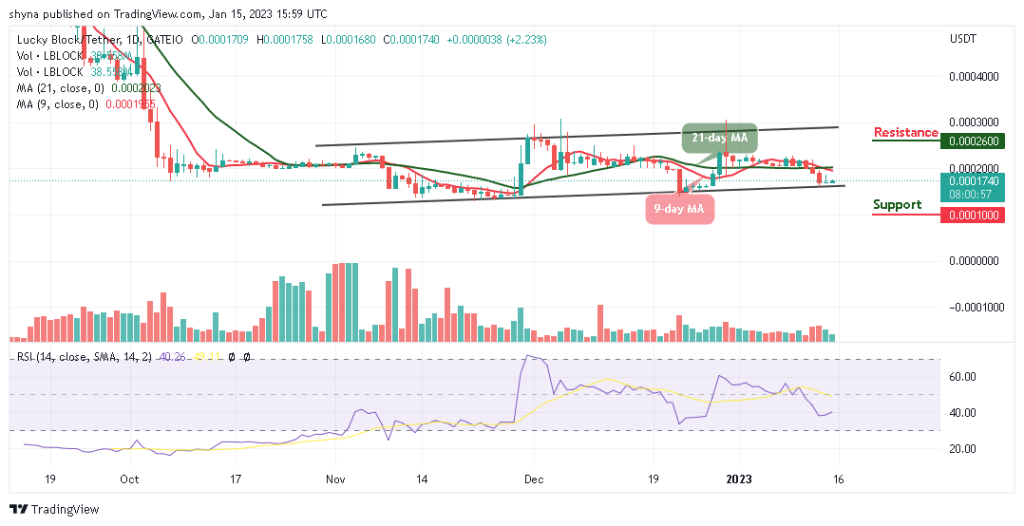
You can purchase Lucky Block here. Buy LBLOCK