Litecoin (LTC/USD) Price Surges to Hit $75, Seeking a Retracement
Estimated Reading Time: 3 minutes
Don’t invest unless you’re prepared to lose all the money you invest. This is a high-risk investment and you are unlikely to be protected if something goes wrong. Take 2 minutes to learn more
Litecoin Price Prediction – November 7
Bears in the LTC/USD market operations are gradually mustering muscles against bulls, following the economic price surges to hit $75, seeking a retracement movement.
According to the analytics, the price is currently trading at $72.923508, with a negative percentage rate of 2.08, meaning that if the current northward forces continue at their current speed, long-position pushers won’t be able to maintain additional uprising forces beyond $75. Bulls may push the price higher against the upper Bollinger Band trend line if it remains below the point for a few days in an attempt to bounce against it.
LTC/USD Market
Key Levels:
Resistance levels: $80, $85, $90
Support levels:$65, $60, $55
LTC/USD – Daily Chart
The LTC/USD daily chart showcases the crypto trade surges that hit the resistance line of $75, seeking a retracement motion.
The Bollinger Band trend lines are placed at $74.445644, $68.577690, and the lower part at $62.709735. The stochastic oscillators are positioned northward from 66.575587 to 85.6851482 points. A series of candlesticks have surfaced from a lower-trading spot of $60 to eventually reach the resistance line of $75.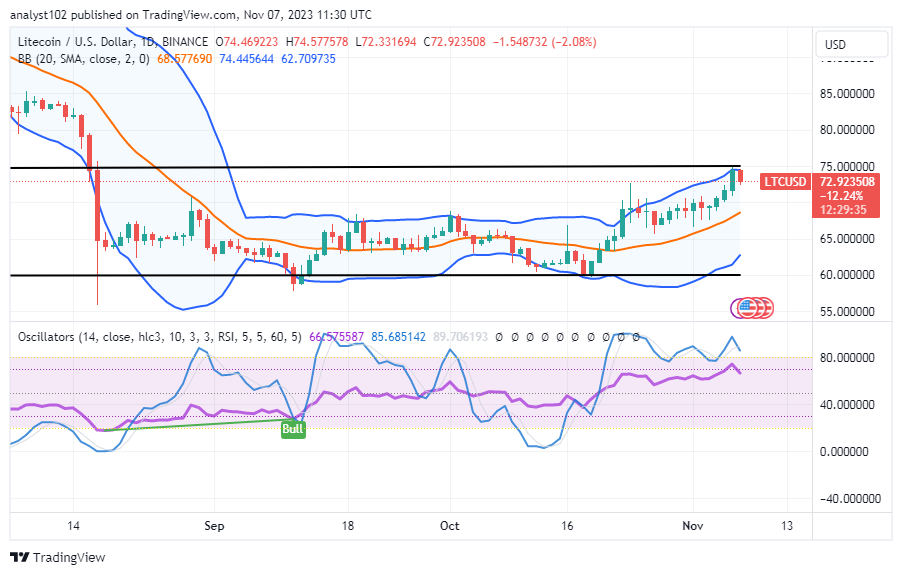
Will purchasing pressure fade around the $75 barrier, where the LTC/USD market is looking for a retracement?
Trading activities marking rises and decreases around the line of $75 have indicated that the possibility of bulls moving further appears not to be sustainable, given the LTC/USD trade surges to hit the value line, seeking a retracement.
If they must take a chance on increasing their positions, they must proceed cautiously with the execution of long-standing position orders around the $75 value line. To profit from the subsequent actions, positions added from the current trading point will need to be made in tandem with a long-term investing strategy.
It is anticipated that the recent price touch with the upper Bollinger Band trend line would create some favorable conditions for sellers to test their abilities to press against the expansion of ascending forces around the logical line of $75. A smart technical trading strategy would be to notify bears of fictitious pull-ups so they can watch for any potential reversal movement and enter it later.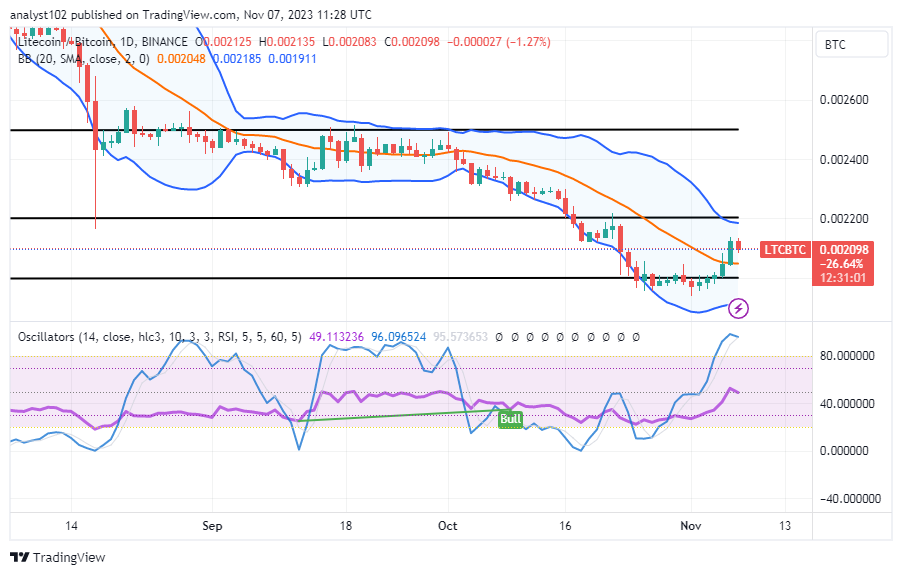
LTC/BTC Price Analysis
In contrast, the daily price analysis chart shows that the Litecoin market surges to hit a resistance closely underneath the trend line of the upper Bollinger Band, pairing with Bitcoin to seek a retracement movement.
The overall technical view indicates the base instrument could lose value soon. The stochastic oscillators are breaking through the overbought area and remaining between the levels of 49.113236 and 96.096524. The price has been slowly moving on a bearish candlestick, as it has been showing, so buyers may need to be somewhat patient before entering the market.
Note: Cryptosignals.org is not a financial advisor. Do your research before investing your funds in any financial asset or presented product or event. We are not responsible for your investing results.
You can purchase Lucky Block here. Buy LBLOCK