Litecoin (LTC/USD) Price Surges, Consolidating Via Barriers
Estimated Reading Time: 4 minutes
Don’t invest unless you’re prepared to lose all the money you invest. This is a high-risk investment and you are unlikely to be protected if something goes wrong. Take 2 minutes to learn more
Litecoin Price Prediction – October 24
The reactions of bulls, countering the effects of bears, have been productive as regards the market operations of LTC/USD, given the crypto-economic price surges, consolidating via barriers lined up around the indicators at the moment.
The financial record has steadily increased from the base value of the lower Bollinger Band trend line, which was roughly $60, to $70. Long-position placers should be systemically strategic in their approach to positional execution, even though the market still has a long path of recoveries to cover and should be approached with caution.
LTC/USD Market
Key Levels:
Resistance levels: $75, $80, $85
Support levels:$65, $60, $55
LTC/USD – Daily Chart
The LTC/USD daily chart showcases the crypto-economic market surges, consolidating via barriers built up around the upper Bollinger Band trend line.
Yesterday’s candlestick finished with a significant bullish trading wall, making the upper Bollinger Band trend line stretch upward to $68.596926, with the middle part situated at $63.744598 and the lower part at $58.892271. The stochastic oscillators have moved northward from 65.990978 to 100 values, signifying that an overbought outlook has been observed in the present transaction lines.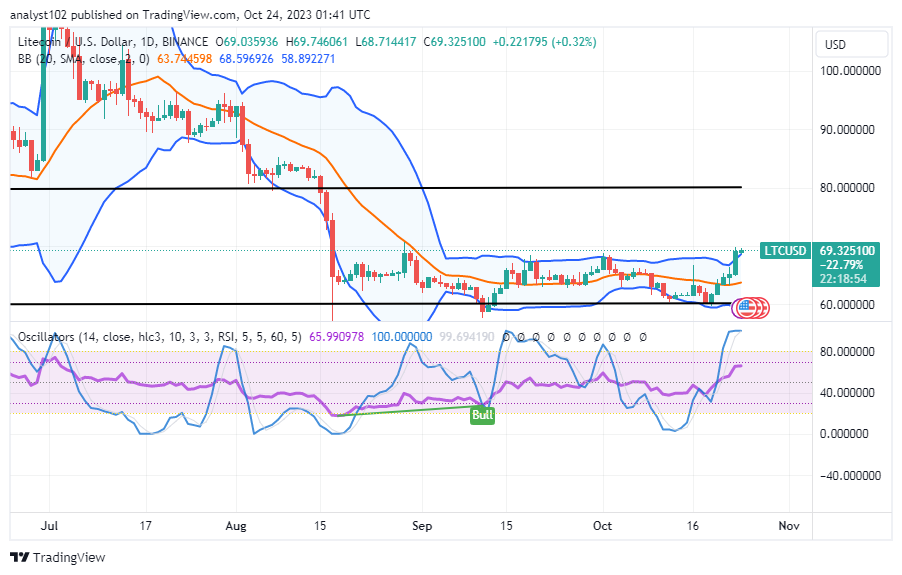
What actions from sellers are anticipated in light of the current increasing motion signal in LTC/USD market activity?
Short-position placers needed to be alerted of making a decent possible comeback while a bearish candlestick is made above the point of the upper Bollinger Band trend line, as the LTC/USD market is currently having the price surge higher, consolidating via barriers.
According to market developments, which pair the value of Litecoin with that of the US dollar, long-term investors will be in the best positions to profit greatly in the long run as the scenario is gradually progressing into complete bullish trending cycles. In other words, any movement toward a pullback could be an attempt to gather momentum for a push past its most recent high zone, or zones, depending on the situation.
Before returning with a shorting entry order, bears would need to wait for a line of active rejections to form around higher resistance-trading zones above the indicators. However, it’s possible that in the upcoming trading days’ sessions, that supposition won’t come true. Therefore, it requires rigorous patience training prior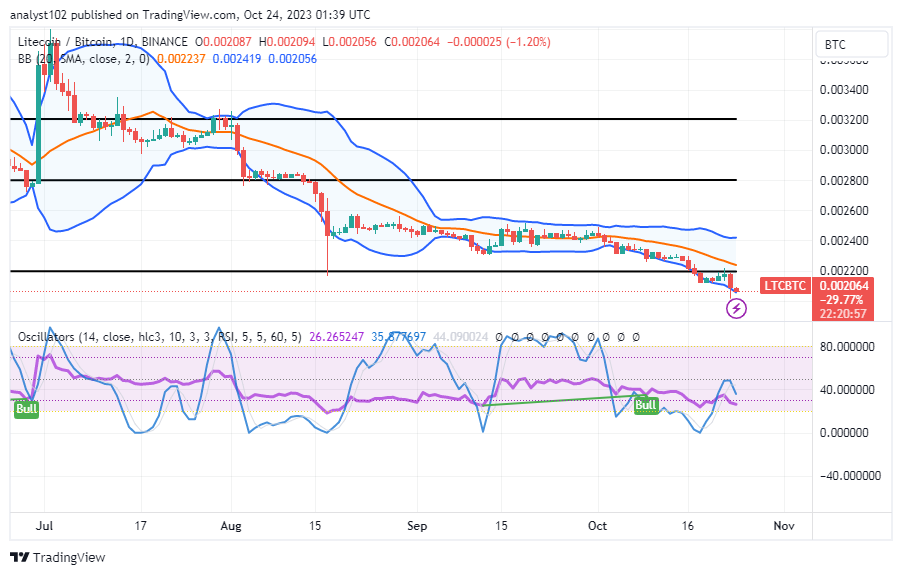
LTC/BTC Price Analysis
In contrast, Litecoin has remained slightly practical and inactive against the trending force of Bitcoin around the lower end of the Bollinger Band trend line, as the trade outlook appears to be consolidating via lower values.
The fact that the Bollinger band trend lines are stretched southward indicates that the base cryptocurrency has been underpriced. Most candlestick patterns have been positioned near the lower Bollinger Band trend line for a considerable amount of time to support the analysis presented above. The short-term northward positioning of the stochastic oscillators highlights the need to wait before entering a position. But soon, buying moments will win out.
Note: Cryptosignals.org is not a financial advisor. Do your research before investing your funds in any financial asset or presented product or event. We are not responsible for your investing results.
You can purchase Lucky Block here. Buy LBLOCK