Litecoin (LTC/USD) Price Goes Lower, Averaging $60
Estimated Reading Time: 3 minutes
Don’t invest unless you’re prepared to lose all the money you invest. This is a high-risk investment and you are unlikely to be protected if something goes wrong. Take 2 minutes to learn more
Litecoin Price Prediction – October 10
Enfeebling pressures coming in slight reduction inputs have surfaced in the trade operations of the LTC/USD price, which have shown that the crypto-economic price goes lower, averaging the pivotal line of $60.
Indicators are currently showing that attempts to forcefully lower the market below the support level of $55 may not be able to hold up over time, given the current state of the financial trade. It would be better for traders to go hit the buy buttons if that had to be the fundamental tenet of technical thinking. Neither buyers nor sellers have had the chance to move outside of the $60 and $70 range-bound zones in a quick manner. Our recommendations favor buying-related activities above selling-related ones.
LTC/USD Market
Key Levels:
Resistance levels: $70, $75, $80
Support levels:$55, $50, $45
LTC/USD – Daily Chart
The LTC/USD daily chart reveals the crypto market goes lower around the lower path of the Bollinger Band, averaging support of $60.
The trending position pattern of the Bollinger Bands shows that long range-bound sessions have been featured within them, as they are placed at $67.199874, $64.891649, and $62.583425. The stochastic oscillators have placed southbound from 43.008447 to 13.514143 values.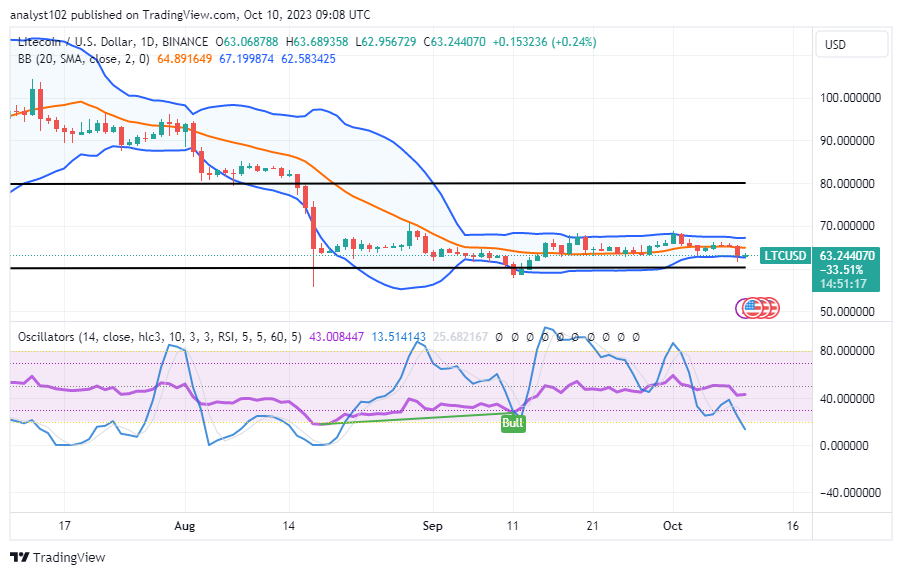
What position of the LTC/USD market is tending to follow subsequently as a ranging motion is ongoing?
There is tentative pressure to allow bears to continue to gain stances against bulls as the LTC/USD market goes lower, averaging the line of $60.
The lower horizontal line has been formed to support the lower Bollinger Band as upward advances are maintained, confirming that buyers are ostensibly continuing to provide high-quality input. $55 has been noted as the largest reduction value to the downside. That feeling forces lengthy position orders to take precedence.
Even if the price tends to shift farther downward from the trending region of the lower Bollinger band trend line, as the current situation foretells, there will not be a big entry for bears to build on. Therefore, it is important to use caution when pushing down in order to prevent unneeded whipsawing periods.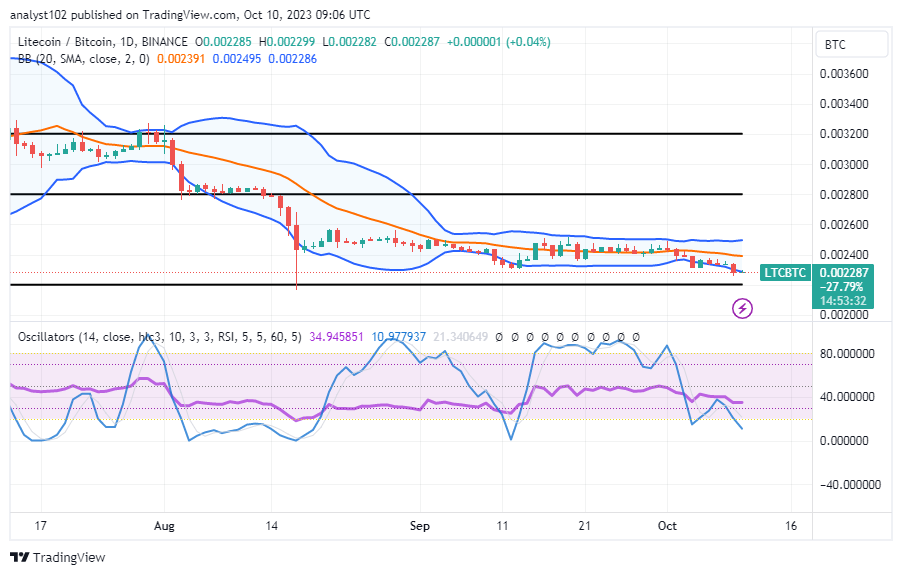
LTC/BTC Price Analysis
In contrast, Litecoin trade goes lower around the trend line of the Bollinger Band at the lower part, averaging the lower horizontal line drawn underneath the indicators.
Bollinger Bands’ overall configuration suggests that sideways price moves are continuing. Candlesticks are displaying a line of lower lows at the time of this technical analysis. The stochastic oscillators are looking for a spot to start moving in a consolidation direction while being oversold. The base cryptocurrency is probably going to put up with a force to rise higher in the meantime.
Note: Cryptosignals.org is not a financial advisor. Do your research before investing your funds in any financial asset or presented product or event. We are not responsible for your investing results.
You can purchase Lucky Block here. Buy LBLOCK