Litecoin (LTC/USD) Market Is Between $70 and $60, Swinging Easterly
Estimated Reading Time: 3 minutes
Don’t invest unless you’re prepared to lose all the money you invest. This is a high-risk investment and you are unlikely to be protected if something goes wrong. Take 2 minutes to learn more
Litecoin Price Prediction – October 7
There has been a level of consistency in the process of how buyers and sellers react in the LTC/USD trade happenings, given that the crypto-economic market is between $70 and $60, swinging easterly.
The trading positions have been degrading toward creating a decent line for long-position takers to leverage their entries onto since they have been blatantly technically inclined. In the long run, they might just need a lot of patience to get there. There are currently signs that the price will move in a risky direction if bears try to push the price below $60 over the long term.
LTC/USD Market
Key Levels:
Resistance levels: $75, $80, $85
Support levels:$55, $50, $45
LTC/USD – Daily Chart
The LTC/USD daily chart reveals that the crypto-economic market is between $70 and $60, swinging easterly to make up for only fewer returns.
In the mood of establishing the authenticity of the range-bound spots around those points mentioned earlier, the Bollinger Bands have placed $67.461140, $65.196096, and their lower part at $62.931052. The stochastic oscillators are placed from 50.438163 to 34.170926, tentatively conjecturing to set back into rising motions.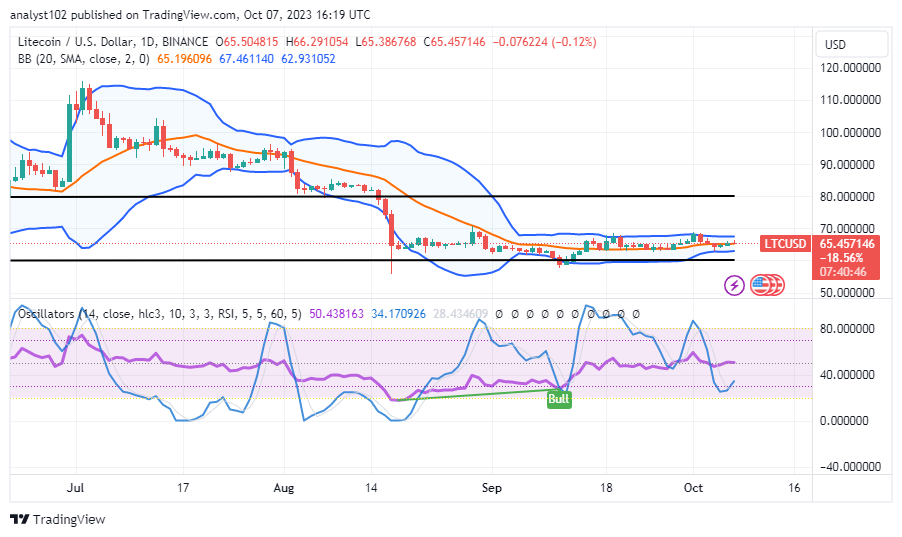
Can the LTC/USD market continue to move further to the downside in relation to the lower Bollinger Band?
It currently appears that bears won’t be making reliable impacts against the lower Bollinger Band trend line, concerning the LTC/USD market operations, as the price has been trading between $70 and $60, swinging easterly.
The lower horizontal line has been formed to support the lower Bollinger Band as upward advances are maintained, confirming that buyers are ostensibly continuing to provide high-quality input. $55 has been noted as the largest reduction value to the downside. That feeling forces lengthy position orders to take precedence.
As seen by past behavior, bulls have over a period of time been losing positions around the $70 line to minor downward pressures applied by bears. Before playing along with a shorting entry, a confirmation signal note must be found using the stochastic oscillators’ reading status at a nearly or in an overbought zone.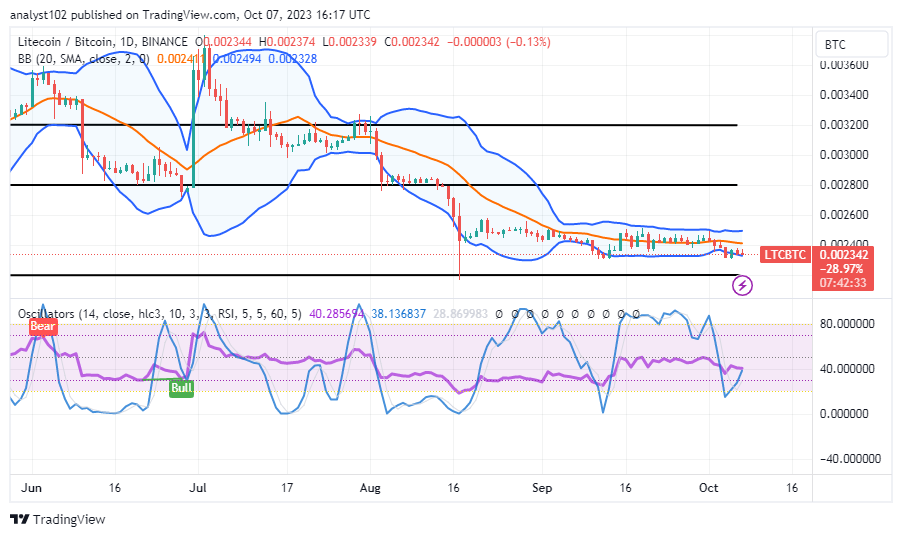
LTC/BTC Price Analysis
In contrast, Litecoin market activity is between well-defined range-bound spots against Bitcoin, enclosing the trend lines of the Bollinger Bands, as the price has been swinging easterly over a long time.
The Bollinger Band trend lines have all been pointing east, with the emergence of bearish candlesticks typically being associated with lower lows. Currently, the stochastic oscillators are being adjusted to indicate the potential for a purchasing signal. In other words, if downward pushes tend to occur even during periods of high intensity, less action should be taken to combat them.
Note: Cryptosignals.org is not a financial advisor. Do your research before investing your funds in any financial asset or presented product or event. We are not responsible for your investing results.
You can purchase Lucky Block here. Buy LBLOCK