Avalanche Price Prediction: AVAX/USD Stays Above $33 Resistance
Estimated Reading Time: 3 minutes
Don’t invest unless you’re prepared to lose all the money you invest. This is a high-risk investment and you are unlikely to be protected if something goes wrong. Take 2 minutes to learn more

Avalanche Price Prediction – December 10
The Avalanche price prediction shows that AVAX touches the resistance level of $34.2 as the coin prepares for another upward movement.
AVAX/USD Long-term Trend: Bullish (Daily Chart)
Key levels:
Resistance Levels: $40, $42, $44
Support Levels: $25, $23, $21
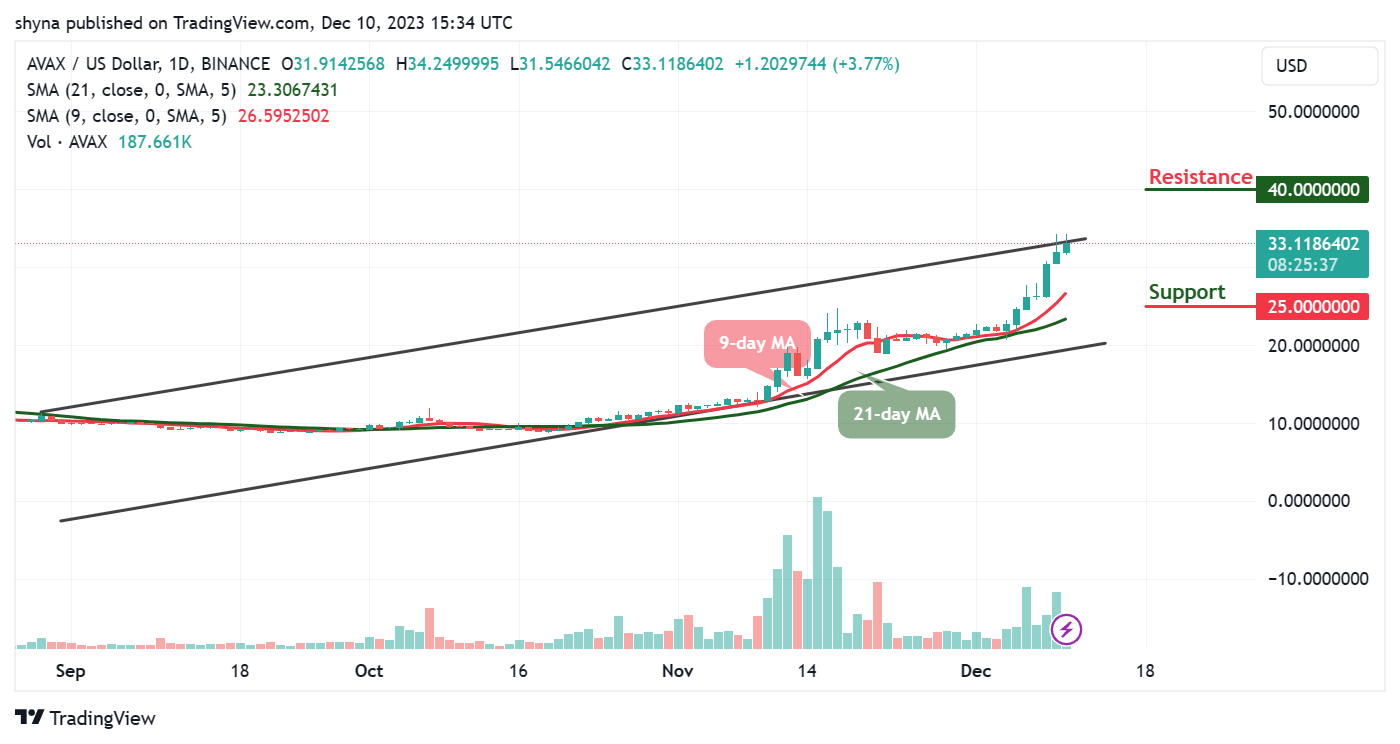
AVAX/USD is trading above the 9-day and 21-day moving averages at $33.1 as the coin prepares to gain additional bullish movement. However, the Avalanche price is likely to extend above the upper boundary of the channel to hit the nearest resistance level of $35 if the bulls put more pressure on the market.
Avalanche Price Prediction: Is $35 Resistance Coming for AVAX?
At the time of writing, the Avalanche price is hovering above the 9-day and 21-day moving averages, any further bullish movement above the $34 resistance level may locate the potential resistance levels at $40, $42, and $44. However, when the new uptrends are gathering, traders may use the moving averages as a pivot resistance point to gauge the strength of the trend. Therefore, if AVAX/USD soars above the channel, this could be a sign of sustainability and could result in a bullish continuation.
On the contrary, if the AVAX price fails to move up; traders may see a price cut toward the lower boundary of the channel, and a further low could bring the price to the support levels at $25, $23, and $21 respectively. As it stands now, the Avalanche price may create more additional gains as the 9-day MA remains above the 21-day MA.
AVAX/USD Medium-term Trend: Bullish (4H Chart)
According to the 4-hour chart, the Avalanche price is heading to the north as the bulls are stepping back into the market by keeping the coin above the 9-day and 21-day moving averages. However, If AVAX/USD slides to the downside, the support level of $28 and below may come into focus.
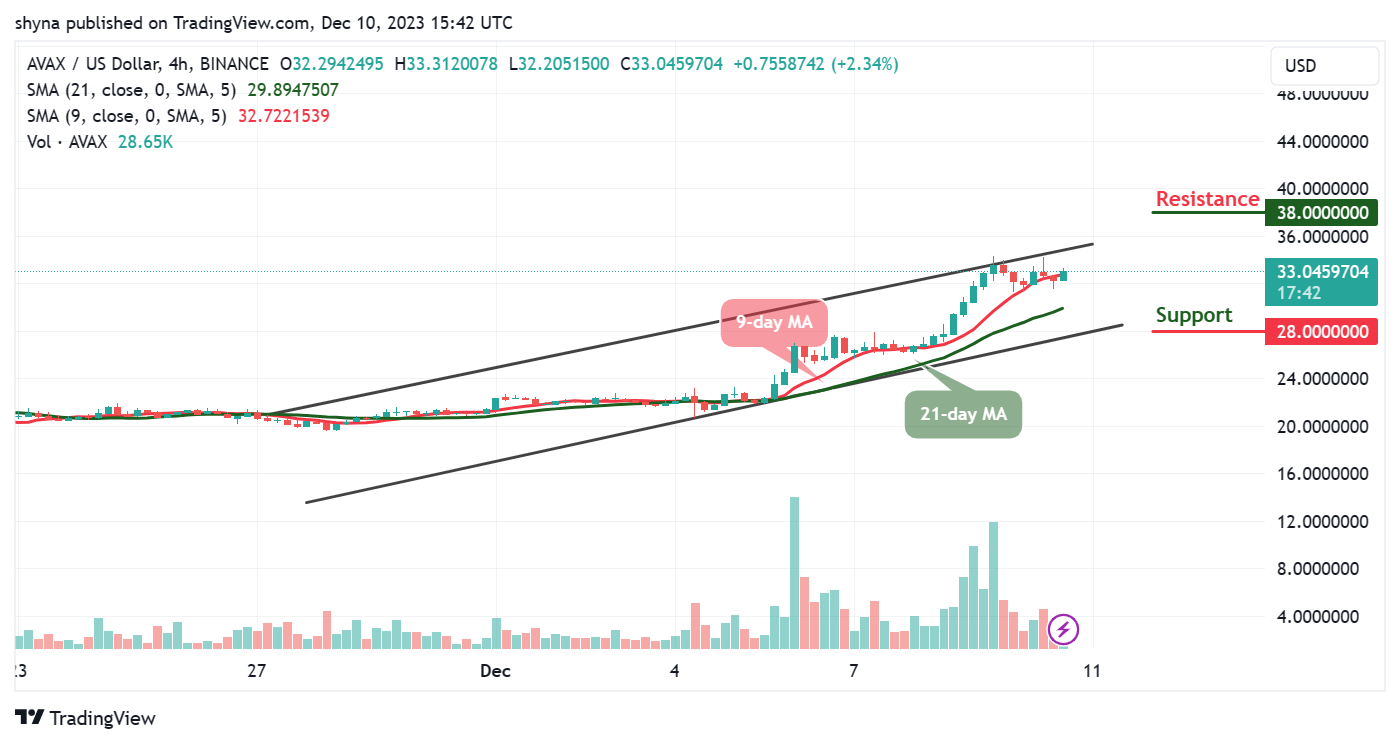
Nevertheless, if the bulls keep the market above the moving averages, traders may expect a touch of the $36 resistance level, and breaking this level may further push the price toward the resistance level of $38 and above as the 9-day moving averages keep hovering above the 21-day moving average, suggesting bullish movement.
You can purchase Avalanche here. Buy AVAX