UMA (UMA/USD) Set to Commence New Consolidation Phase
Estimated Reading Time: 2 minutes
Don’t invest unless you’re prepared to lose all the money you invest. This is a high-risk investment and you are unlikely to be protected if something goes wrong. Take 2 minutes to learn more
UMAUSD Key Zones
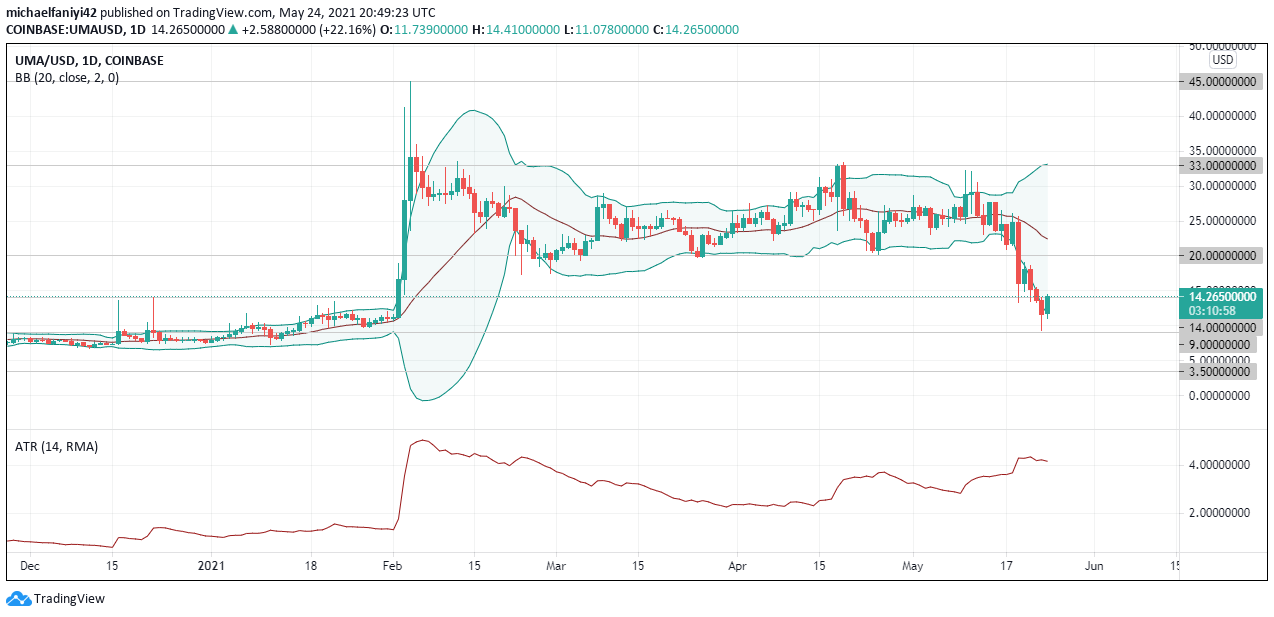
Demand Zones: 45.00, 33.00, 20.00
Supply Zones: 3.50, 9.00, 14.00
UMAUSD has been very conformable to its key levels. The resistance and supply levels have been very influential in determining the price action. The 14.00 resistance level has kept the market at bay since 20th September 2020 until an incredible upsurge shot the price to the skies at 45.00 key level. The 45.00 key level has been the highest ever UMA has gotten to and only once. The bears immediately plunged the coin after the upsurge past the 33.00 support zone. Since then the price consolidated using 33.00 as resistance and 20.00 as support. The consolidation lasted from the 6th of February 2021 to 18th May 2021. By the 19th of May 2021, there was another break out of the market downward to 14.00 resistance level. Price broke further downward to 9.00.

UMA Market Anticipation

The Bollinger Bands was squeezed during the consolidation phase and opened up as the market went down. The strong movement in the market has been due to much volatility in the market as shown by the ATR (Average True Range) which is currently at 4.16.
The 9.00 supply has been strong enough to repel price upwards and a strong bullish candle can be seen on the daily time frame. UMAUSD is set to begin another consolidation phase which should range between the 9.00 supply and the 20.00 demand.
On the 4-hour chart, the Bollinger Bands are enclosing the candles in a descending trend. The candles have been cranking between the middle line and the lower border of the Bollinger Bands. Currently, there has been a bullish engulfing which has bounced off the 9.00 support level. The bullish engulfing has broken above the middle line of the Bollinger Band, to show a change in market direction.
The volatility of the market is set to aid the upturn in market movement. The ATR is currently at 1.25.
Note: new.cryptosignals.org is not a financial advisor. Do your research before investing your funds in any financial asset or presented product or event. We are not responsible for your investing results.