Litecoin (LTC/USD) Trade Is on a Pause, Nursing an Indecision
Estimated Reading Time: 3 minutes
Don’t invest unless you’re prepared to lose all the money you invest. This is a high-risk investment and you are unlikely to be protected if something goes wrong. Take 2 minutes to learn more
Litecoin Price Prediction – September 26
Transaction lines to the downward path in the LTC/USD have been relatively keeping in on feeble forces toward the support point of the $0.60 as the crypto trade is on pause, nursing an indecision sentiment.
Consistently between the marks of $60 and $70, there has been a prolongation of forces to spring back to the moon side. A signal that depression will continue below the greater figure for a time is still present. Because of that assumption, it would be essential for the price to decline from its current trading level in order to generate pressure and eventually return to the mooning route.
LTC/USD Market
Key Levels:
Resistance levels: $75, $80, $85
Support levels:$55, $50, $45
LTC/USD – Daily Chart
The LTC/USD daily chart showcases that the crypto-economic trade is on pause, nursing an indecision-making session around the value of $65 over time.
Indicators from an overall reading point of view suggest that the major barrier lines have been set from $70 to $74.851965. The 14-day SMA trend line is underneath the 50-day SMA trend line. The stochastic oscillators have been lackadaisically moving in a slanting southbound direction, ranging from 69.85 to 63.94 points. That implies that buyers may still need to exercise patience toward achieving the ideal volatility to back their entries.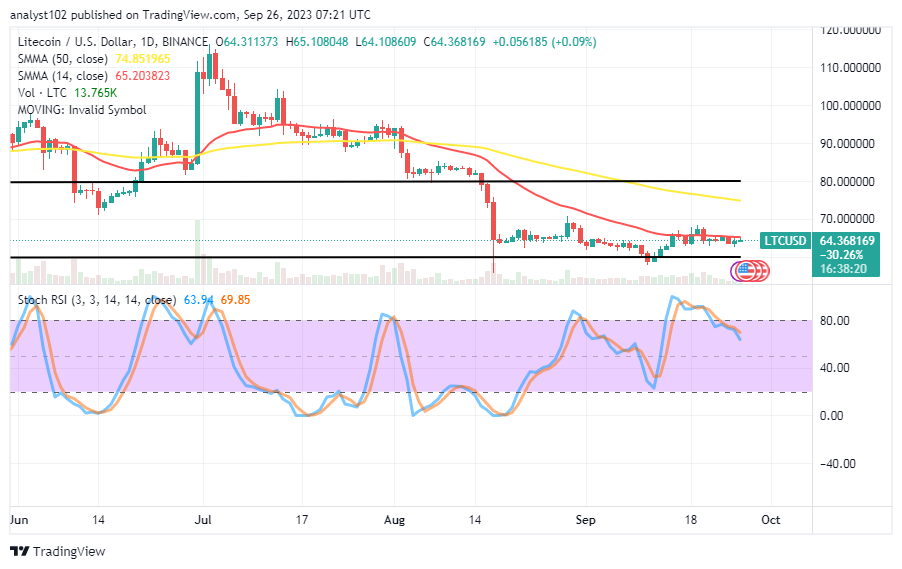
What price-force position must exist before bulls may see a good point in the current LTC/USD market operations?
The positioning of the stochastic oscillators has to traverse a lower-trading region to portend a maximal sign toward getting a better positive point back to the upside, given that the LTC/USD market is on pause, nursing an indecision mode.
As there has been a recession trading trait, it might be a ruse to divert the focus of long-position placers. In any case, it is advisable to continue pushing for upward movement rather than falling further, particularly if the price starts to flip back to the $60 line.
If not treated carefully, the process leading to smashing through fundamental support levels from the $55 might put bears in the LTC/USD market operations in a tight risk-trading station. Before deciding when to execute an entry, sellers may need to keep an eye out for potential replies of price action toward or around the resistance of $70. a terrifying outbreak of the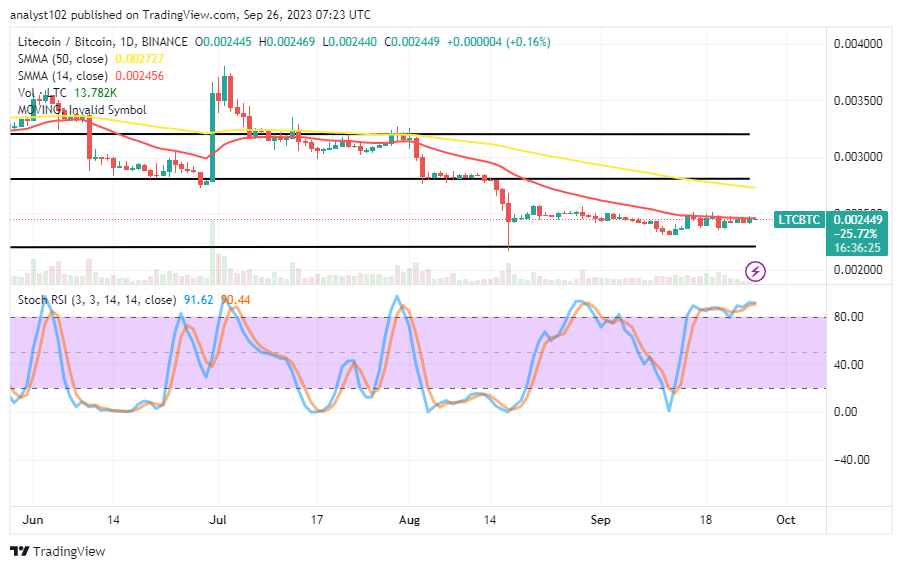
LTC/BTC Price Analysis
In contrast, Litecoin is on a pause moment, pairing with Bitcoin, following exhaustion of capacity to the point of producing an overbought condition, nursing an indecision situation along the transaction line.
The composition pattern of the indicators showcases that the 14-day SMA is underneath the 50-day SMA. Candlesticks that have been showing prices that exhibit up-and-down swaying qualities support the lack of direction around the smaller moving average. The stochastic oscillators are positioned between 90.44 and 91.62, indicating that the quoted cryptocurrency is on the verge of gaining ground versus its underlying cryptocurrency.
Note: Cryptosignals.org is not a financial advisor. Do your research before investing your funds in any financial asset or presented product or event. We are not responsible for your investing results.
You can purchase Lucky Block here. Buy LBLOCK