Ethereum Declines Above $1,523.59 but Risks Further Decline
Estimated Reading Time: 2 minutes
Don’t invest unless you’re prepared to lose all the money you invest. This is a high-risk investment and you are unlikely to be protected if something goes wrong. Take 2 minutes to learn more

Free Crypto Signals Channel
Ethereum Price Long-Term Analysis: Bearish
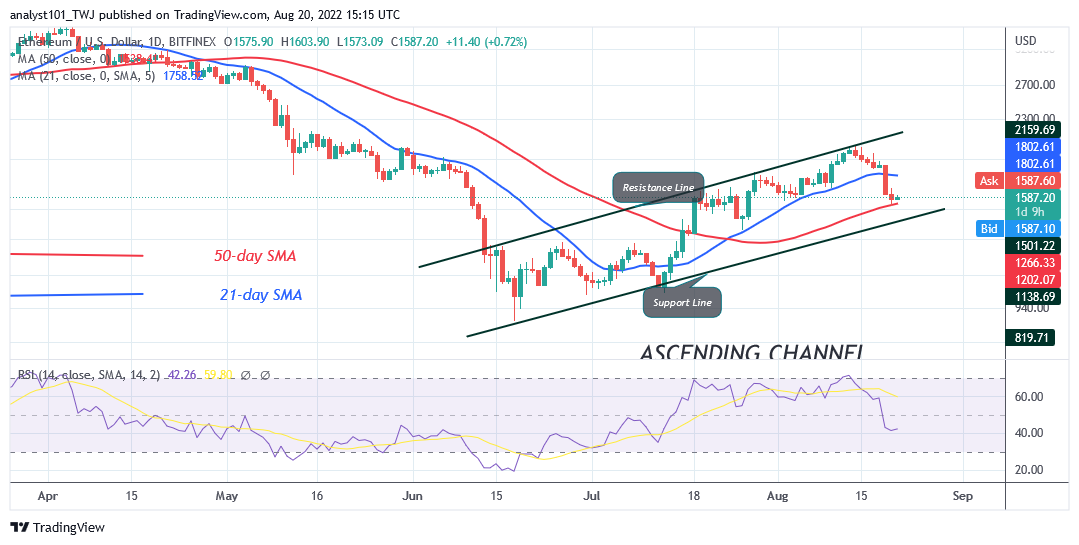
Ethereum (ETH) price is in a downward correction as it declines above $1,523.59 . However, the altcoin found support above the 21-day line SMA. The implication is that Ether is likely to be range bound between the moving average lines for a few days. The crypto will trend when the moving average lines are breached. Nonetheless, if the 50-day line SMA holds, Ether will rise and revisit the previous high of $2,030. The range-bound move will continue if the bulls face rejection at the 50-day line SMA. On the other hand, if the bears break below the 50-day line SMA, the downtrend will resume. The market will decline to the previous low at $1,449 or $1, 029.90.
Ethereum Indicator Analysis
ETH is at level 42 of the Relative Strength Index for period 14. Ether has fallen to the bearish trend zone because of the recent decline. Ether’s price is between the moving average lines which indicates a range-bound move of the coin. ETH/USD is below the 80% range of the daily stochastic. The altcoin is in a bearish momentum.
Technical indicators:
Major Resistance Levels – $2, 600, $2,800, $3,000
Major Support Levels – $1.500, $1, 300, $1,100
What Is the Next Direction for Ethereum?
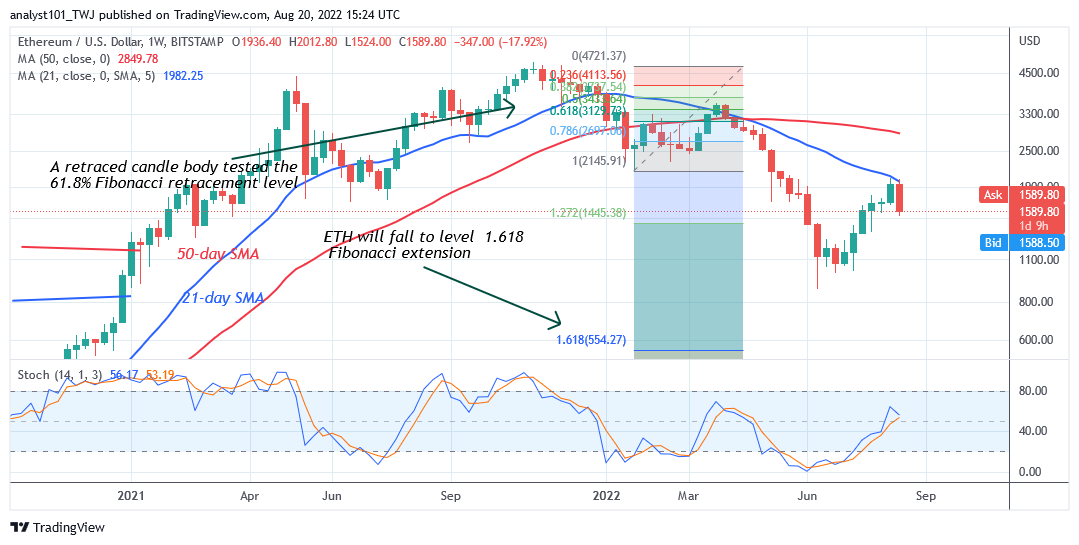
Ether price is in a downward move as it declines above $1,523.59 . The current selling pressure is likely to continue as it faces rejection at the recent high. Meanwhile, on a weekly chart; a retraced candle body tested the 61.8% Fibonacci retracement level on March 28. The retracement suggests that ETH will fall to level 1.618 Fibonacci extension or $554.27. From the price action, Ether is falling as it reaches the low of $1,589.80.
You can crypto coins here. Buy LBLOCK
Note: Cryptosignals.org is not a financial advisor. Do your research before investing your funds in any financial asset or presented product or event. We are not responsible for your investing results