Uniswap (UNI/USD) Price Trades Under Selling Pressures
Estimated Reading Time: 3 minutes
Don’t invest unless you’re prepared to lose all the money you invest. This is a high-risk investment and you are unlikely to be protected if something goes wrong. Take 2 minutes to learn more

Free Crypto Signals Channel
UniswapPrice Prediction – March 3
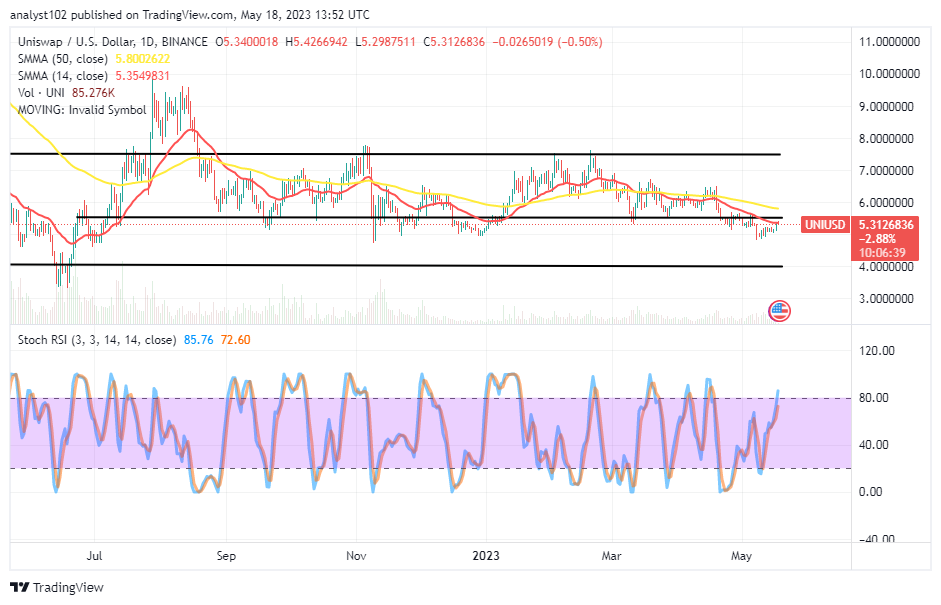
The business operations outlook of the UNI/USD market portends the crypto-economic price trades under selling pressures over time. The crypto’s worth has seen a smaller pace of trading between $10 and $9 lines or thereabouts, keeping a percentage of -0.28.
UNI/USD Market
Key Levels:
Resistance levels: $12, $14, $16
Support levels: $7, $5, $3
UNI/USD – Daily Chart
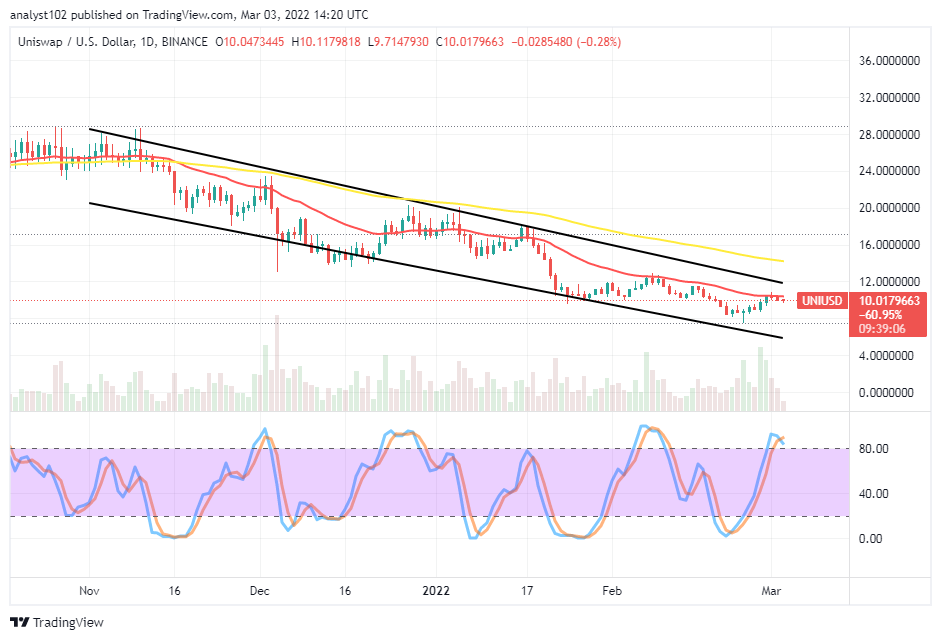
The UNI/USD daily chart shows the crypto-economic price trades under selling pressures as variant candlesticks have been emerging rejected around the trend line of smaller SMA trend line. The upper bearish trend line is over the 14-day SMA indicator underneath the 50-day SMA indicator. The Stochastic Oscillators are in the overbought region, trying to cross the lines southbound within it. That indicates a downward force is imminent in the near time.
Can there be more downs in the UNI/USD market valuation as the crypto-economic price trades under selling pressures?
The featuring of more downs in the UNI/USD market valuation is likely to be in a smaller candlesticks formation outlook if the price will have to satisfy a downward-moving continuation setting as the crypto-economic price trades under selling pressures. Surging higher of the crypto economy at this point of trading capacity seems not healthy to sustain the aftermath of such a presumed sentiment. Price needed to move down again to find a new support line below the higher trading point.
On the downside of the technical analysis, the UNI/USD market short-position takers have to solidify their stances around the 14-day SMA underneath the $12 resistance trading level. Going by the reading of the Stochastic oscillators in the overbought region, there may still be more downs in a slow-and-steady moving posture, slightly succumbing to a downing motion. 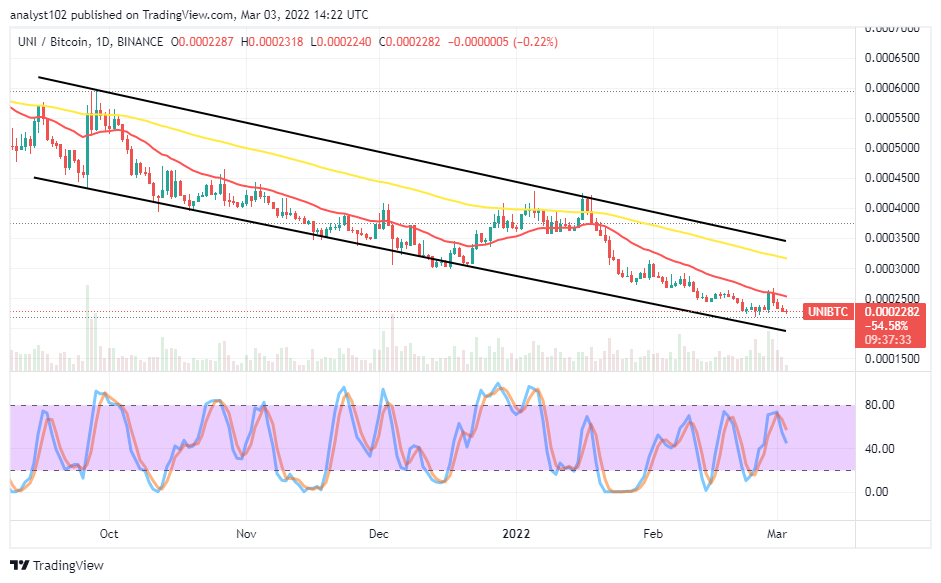
UNI/BTC Price Analysis
In comparison, Uniswap has a lesser capacity to push against Bitcoin. The cryptocurrency pair price trades under selling pressures. The 14-day SMA indicator is underneath the 50-day SMA indicator. The bearish channels trend lines drew southward to enclose the SMAs. The Stochastic Oscillators have crossed southbound within the 80 and 40 ranges. That suggests the base crypto is still somewhat under a falling force against the most valuable counter crypto.
Note: Cryptosignals.org is not a financial advisor. Do your research before investing your funds in any financial asset or presented product or event. We are not responsible for your investing results.
You can purchase Lucky Block here. Buy LBlock: