Litecoin (LTC/USD) Market Dumps, Settling for Rallying Motions
Estimated Reading Time: 3 minutes
Don’t invest unless you’re prepared to lose all the money you invest. This is a high-risk investment and you are unlikely to be protected if something goes wrong. Take 2 minutes to learn more
Litecoin Price Prediction – August 22
There have been financial reports stating that the LTC/USD market dumps, settling for rallying motions after making efforts to spring up from a reduction spot beneath the crucial point of $60.
Given that a rebound has been seen against the lower-trading spot of $60 going back approximately six days of operations to the present, buyers should be preparing to launch long-term position orders in light of the current deepening depth that the falling force has produced. The price is fluctuating close to $66.326939, maintaining a 1.00 percent downward percentage.
LTC/USD Market
Key Levels:
Resistance levels: $80, $90, $100
Support levels:$60, $55, $50
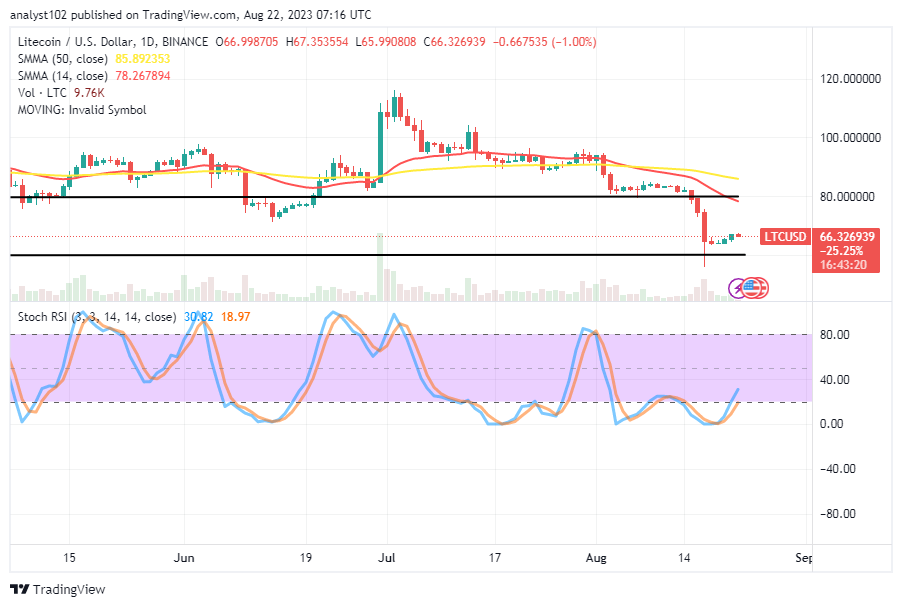
LTC/USD – Daily Chart
The LTC/USD daily chart portrays the crypto market dumps from a logical trading spot of around $80 as a result of bulls’ ineptitude to form a firm baseline, and it is currently settling for a round of rallying motions at a lower trading spot of $60.
The 14-day SMA indicator is placed at $78.267894 in a southward-bending mode underneath the $85.892353 value of the 50-day SMA indicator. The stochastic oscillators have crossed northbound from the oversold region, positioning from 18.97 to 30.82 points.
What pattern of pushes is likely to persist in the price for a while before we start to witness dependable returns in the valuation of LTC relative to the US coin?
It is expected for the LTC/USD trade to resume sideways below the trend lines of the moving averages for some time before pushing into a definite direction as the cryptocurrency market dumps, settling for rallying motions around the point of $60.
A short line of lows is liable to occur around the value line of $60 purposely to produce reliable decent entries for long-position placers. Nevertheless, the current point of transaction could be a good moment for buying orders ahead of volatile moves that will be in favor of bulls afterward.
Even though there may be additional ways for prices to fall, decreases in size often don’t last any longer than is necessary. As a result, sellers should exercise extreme caution this time around when thinking about a new shorting order.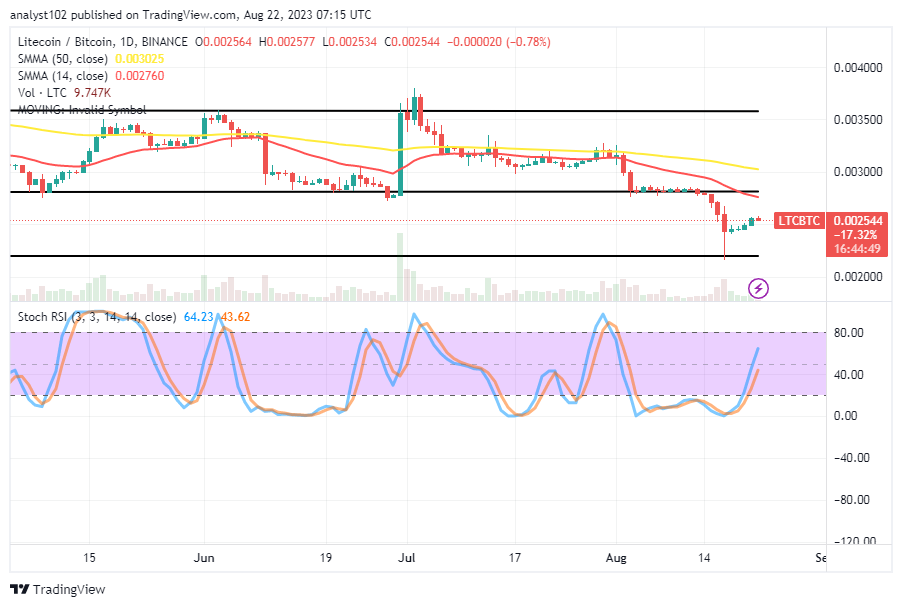
LTC/BTC Price Analysis
In contrast, the Litecoin transaction line dumps against the trending weight of Bitcoin, settling for rallying motions from the lower horizontal line drawn beneath the trend lines of the moving averages.
They are momentarily bent southward above the current trading zone, with the 14-day SMA indicator below the 50-day SMA indicator. From the oversold area, the stochastic oscillators have curved northward to remain between the values of 43.62 and 64.23. In order to issue a cautionary notice against having a dependable, smooth run to the topside, a smaller force has appeared to make a sluggish reversal signal.
Note: Cryptosignals.org is not a financial advisor. Do your research before investing your funds in any financial asset or presented product or event. We are not responsible for your investing results.
You can purchase Lucky Block here. Buy LBLOCK