Litecoin (LTC/USD) Trade Is Ranging, Aiming a Recovery
Estimated Reading Time: 3 minutes
Don’t invest unless you’re prepared to lose all the money you invest. This is a high-risk investment and you are unlikely to be protected if something goes wrong. Take 2 minutes to learn more
Litecoin Price Prediction – August 15
Forces demonstrated by the LTC/USD market bears over time have been lessened to a state where the crypto-economic trade begins ranging around $80, aiming for a recovery in the process.
While the price is currently experiencing a drop, some momentum has been lost in the Litecoin commercial operation against the US coin, extending from the base of resistance of 120. A long position in the cryptocurrency market in its current ranging areas may successfully result in revisiting a lower support trading line of $70 in a slow-and-steady pushing mode before letting the market resume its upward trends later.
LTC/USD Market
Key Levels:
Resistance levels: $90, $100, $110
Support levels: $75, $70, $65
LTC/USD – Daily Chart
The LTC/USD daily chart reveals that the crypto-economic trade is ranging around the trade spot of $80 and aiming for a recovery motion from underneath the Moving Averages’ points.
The 14-day SMA indicator is at $87.28, closely beneath the $90.33 value line of the 50-day SMA indicator. The Stochastic Oscillators have been noted to have resumed a consolidation movement, running for a week and some days around the point of 20 downward to pick parts of the oversold region. And they are currently positioned from 17.25 to 15.20 to signify that a slight move to the downside has been experienced.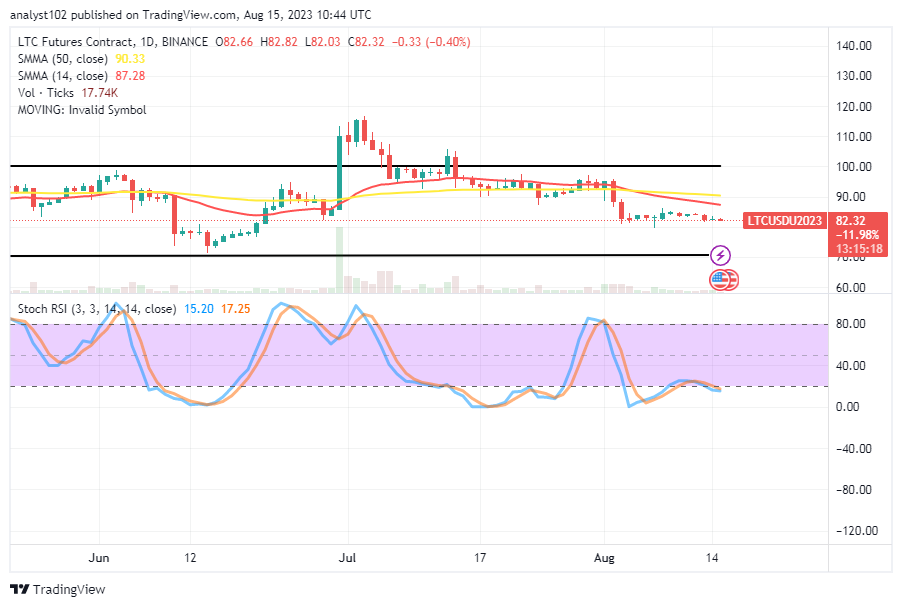
Should short sellers on the LTC/USD market maintain their positions beyond the $80 barrier as it is reached?
Presently, the LTC/USD market is ranging around the $80 line, and the crypto trade is aiming for a recovery from this point. It would be logically okay for sellers to put it off for a while, considering the velocity to the south now heads to less-active moments.
In the meantime, if the reading postures signal of the Stochastic Oscillators is anything to go by, long-position takers should begin to fasten their belts toward regaining decent buying entries from or between $80 and $70 values.
Playing along with the potential for the LTC/USD trade to turn bearish near the $80 mark could be somewhat advantageous only if bulls tend to wane near the line. And even though it will ultimately play out, people shouldn’t focus too much on such forces.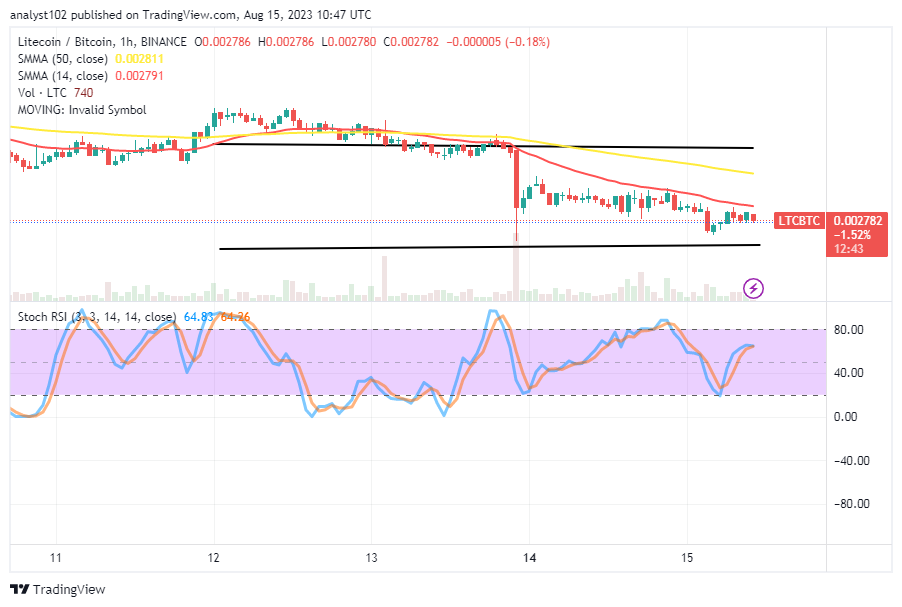
LTC/BTC Price Analysi
In contrast, the Litecoin market is trading in a lower trading zone against Bitcoin. And it is also aiming for a recovery process to go along with it.
When closely examining the Stochastic Oscillators’ current location, it appears that the former trading instrument is running the risk of a downward-shifting scenario. The 50-day SMA trend line is positioned above the different candlestick forms, and the 14-day SMA trend line is placed over them to indicate that the market has not yet recovered from a slump. It indicates that purchasers might still need to wait for a pattern of repositioning that will indicate that the oscillators are properly positioned back at lower values to signpost the start of subsequent increases.
Note: Cryptosignals.org is not a financial advisor. Do your research before investing your funds in any financial asset or presented product or event. We are not responsible for your investing results.
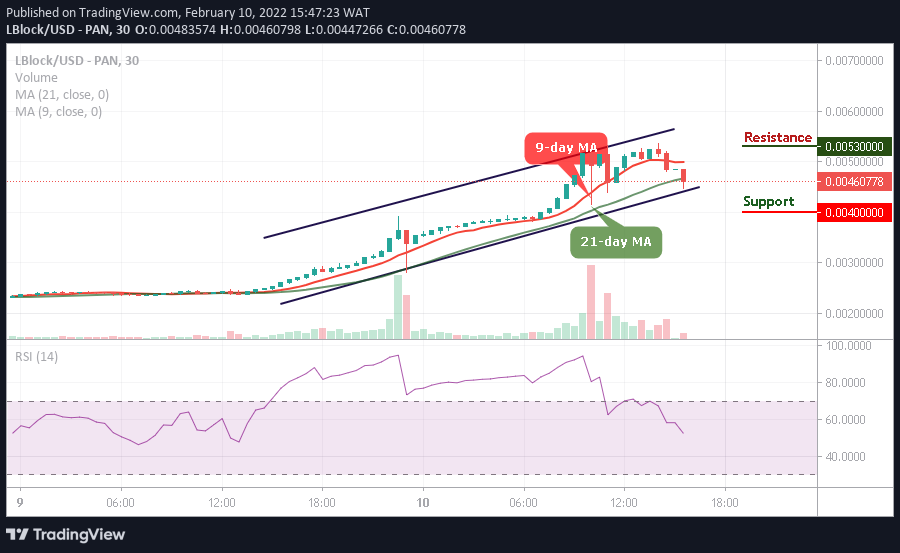
You can purchase Lucky Block here. Buy LBLOCK