0x (ZRXUSD) Resistance Line Pulls Market Price
Estimated Reading Time: 2 minutes
Don’t invest unless you’re prepared to lose all the money you invest. This is a high-risk investment and you are unlikely to be protected if something goes wrong. Take 2 minutes to learn more
ZRXUSD Analysis – Market Price Is Drawn Towards the Resistance Line Border
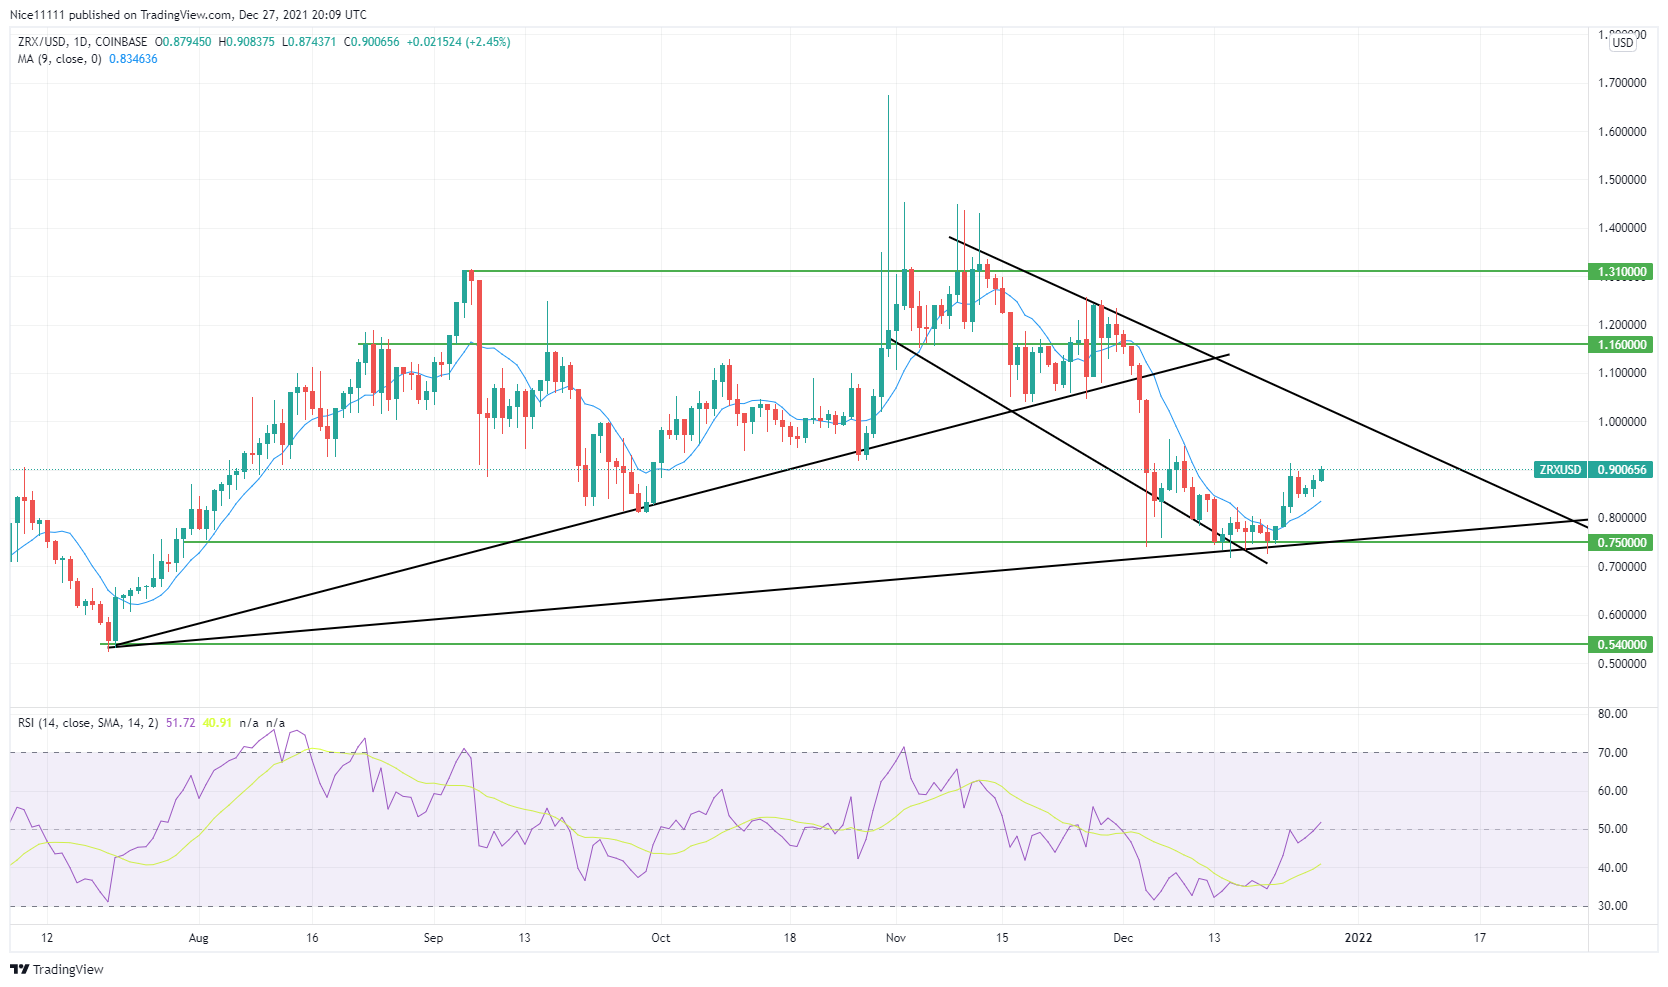
ZRXUSD resistance held the bulls down at $1.160 on the daily chart. This caused the bears to sweep in and swing the price to $0.750, which was a confluence zone. The dive low in the market violated the initial upward trend.
ZRXUSD Major Zones
Resistance Zone: $1.310, $1.160
Support Zone: $0.540, $0.750
The month of December began with falling prices in the market. The moving average on the daily confidently dominated the bearish candles. This fall from $1.310 with the struggling bulls has formed lower highs and lower lows. This is so signified by the downward channel. The resistance line has pulled the price to $0.750.
The dip in the market is followed by a bounce off the support zone. The Relative Strength Index strings also crossed upward at the same time. Three rising soldiers also formed and rose past the nine moving average. The market price took off from the support line towards the resistance line.

Market Anticipation
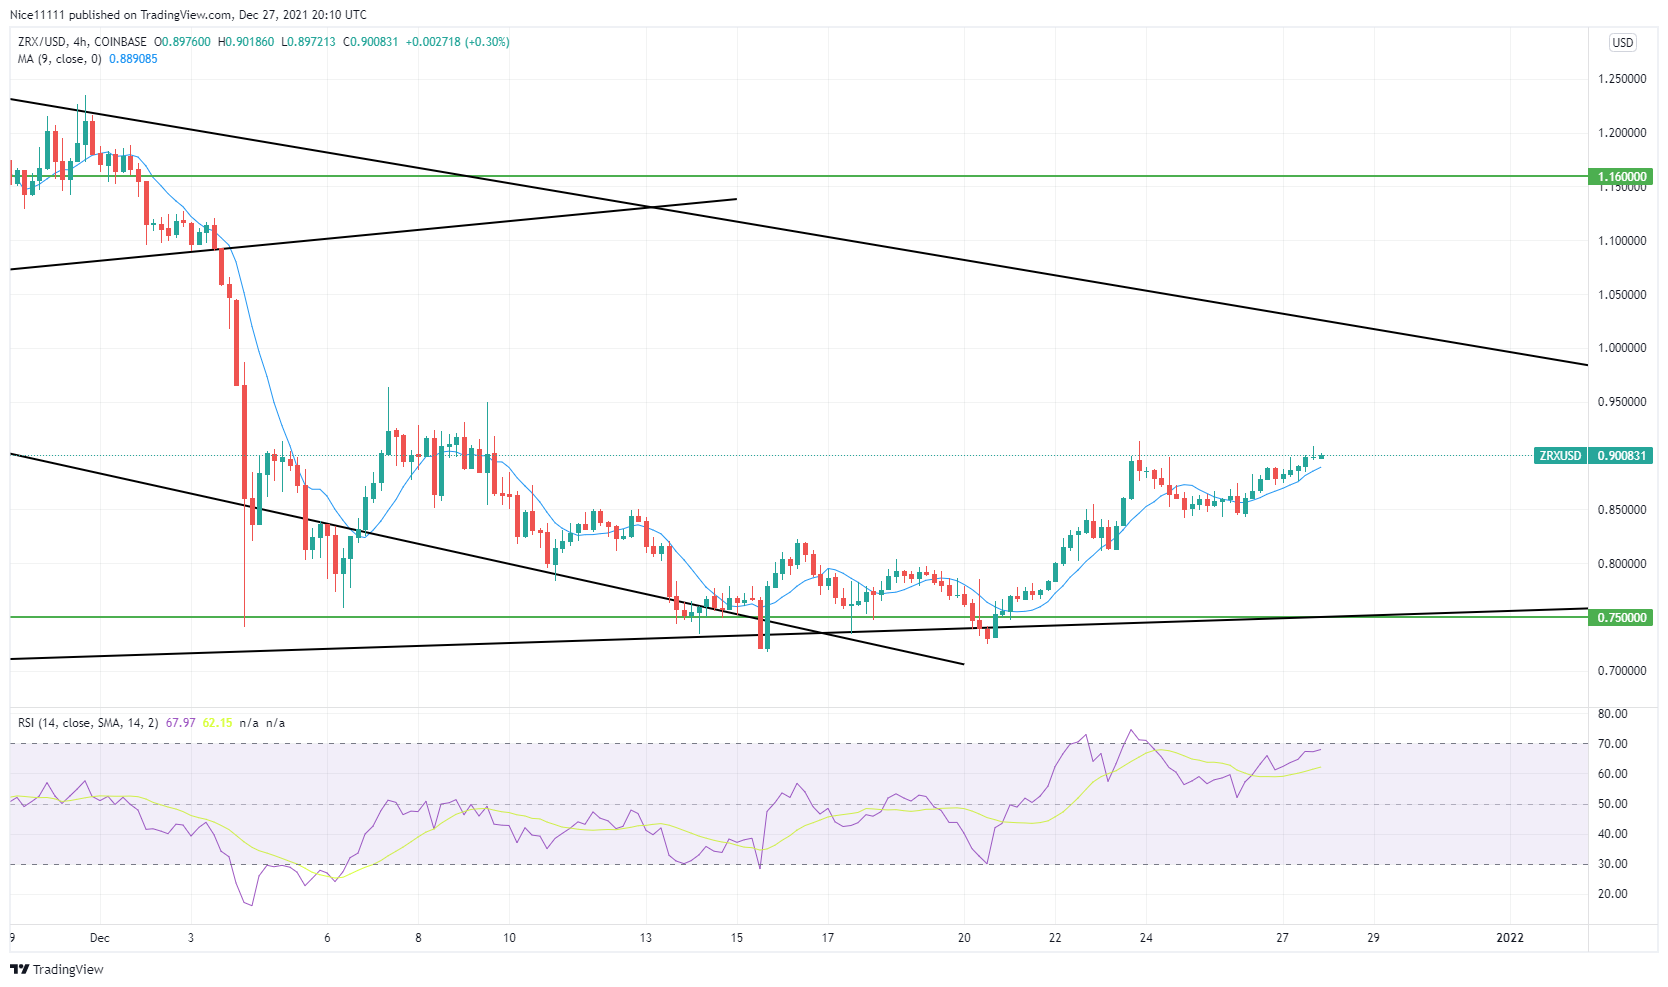
The market price has steadily pumped from the support zone. This is seen with the support of the Moving Average period 9. The immediate market structure has been changed, with higher lows and higher highs forming subsequently after previous lows and highs.
The market is aiming for the borderline, which is the resistance line in the downward channel. The defense of the demand zone at $0.750 is weak, so the support zone is likely to be attacked once more to drive the market price towards $0.540.
You can purchase crypto coins here: Buy Tokens
Note: Cryptosignal.org is not a financial advisor. Do your research before investing your funds in any financial asset or presented product or event. We are not responsible for your investing results.