Solana (SOL/USD) Price Sets Retracing, Keeps Above $80
Estimated Reading Time: 3 minutes
Don’t invest unless you’re prepared to lose all the money you invest. This is a high-risk investment and you are unlikely to be protected if something goes wrong. Take 2 minutes to learn more
Solana Price Prediction – January 12
A persistent loss of uprising momentum in the exchanging operations of Solana against the valuation of the US currency, given the crypto-economic trade currently sets retracing below $120 as it keeps above $80.
Following the price’s touch of the lower Bollinger Band, the indicator that represents the gravitational forces has been moved to prevent the observation of more free retracement movements. If the moves do not acquire further corrections beyond the lesser point of the indicators in the near future, long-position takers are anticipated to push solidly into the north soon, pending the period of witnessing a little upswing length.
SOL/USD Market
Key Levels:.
Resistance levels: $115, $125, $135
Support levels: $80, $75, $70
SOL/USD – Daily Chart
The SOL/USD daily chart shows that the crypto market is retracing and staying above the point of $80.
The Bollinger Band indicators have remained positioned around $120 and $85 values to showcase that an upward pressure motion is in place. The stochastic oscillators were briefly placed eastward around the values of 60 and 40. The formation of candlesticks has been in a short-slanting mode, displayed in a descending pattern.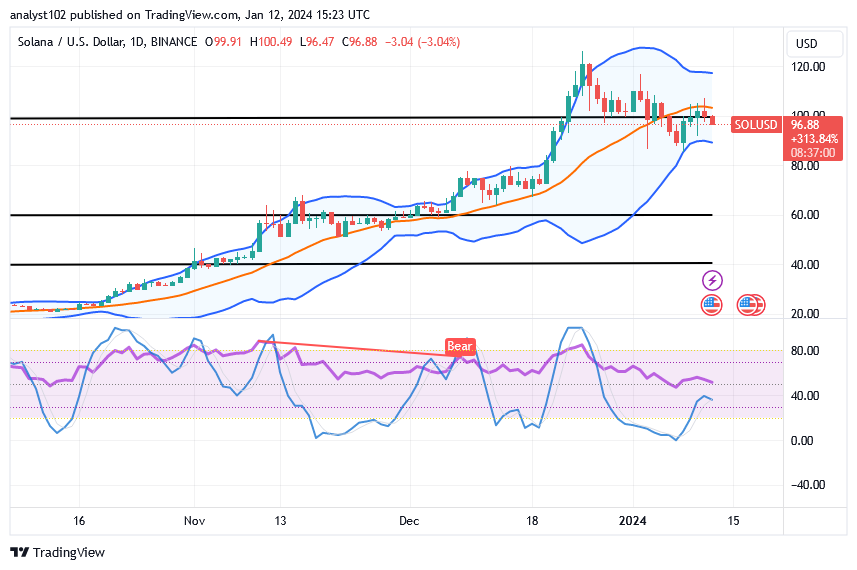
Which underlying support line will the SOL/USD market face in terms of a critical decline scenario?
The crucial support trade line has been seen in pursuance of the current retracemennt process pattern to take place around the value of $80, given that the SOL/USD market sets retracing and keeps above the value line.
Expectations that upward pressure will prevail after regaining most of the positions around the trading axis of the lower Bollinger Band trend line have increased after the transaction line of $80 was spotted. In order to better comprehend when the price tends to move decently, it is technically desirable to observe the oscillators’ blue line relocate in the oversold area and assume a northward-pointing stance.
The candlesticks from yesterday and today have shifted lower after touching the mid-bollinger band trend line, indicating a declining pathway. Closing technical analysis indicates that purchasers will find it more challenging to make breakthroughs.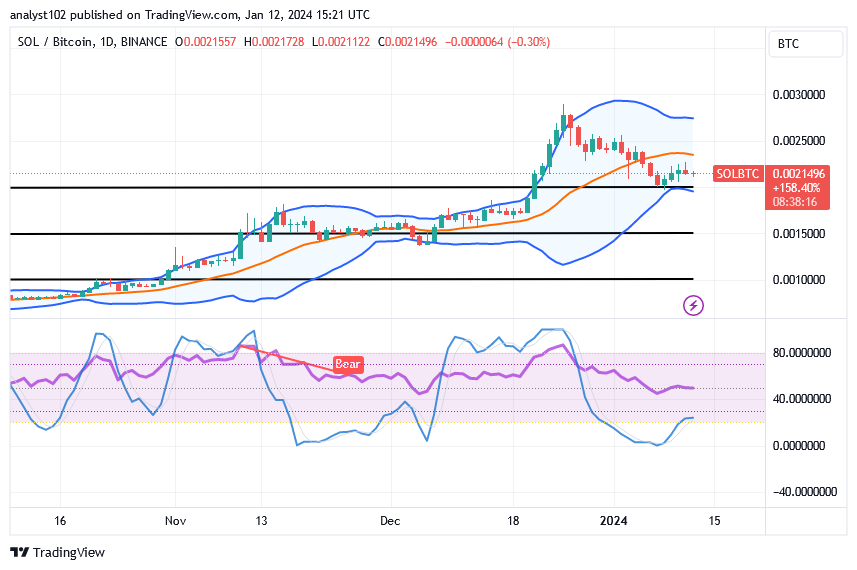
SOL/BTC Price Analysis
In contrast, the Solana trade sets, retracing through the points of the Bollinger Bands, keep above the lower Bollinger Band.
To demonstrate that certain degrees of falling force have not yet reached their full overshoot, the stochastic oscillators have been fluctuating in the oversold area. The trend lines of the Bollinger Band are stationed at strategic values and are oriented northward. A bearish candlestick is beginning to appear, indicating that a falloff may yet occur.
Note: Cryptosignals.org is not a financial advisor. Do your research before investing your funds in any financial asset or presented product or event. We are not responsible for your investing results.
You can purchase Lucky Block here. Buy LBLOCK