Solana (SOL/USD) Market Goes Correcting, Finding a Pivot
Estimated Reading Time: 4 minutes
Don’t invest unless you’re prepared to lose all the money you invest. This is a high-risk investment and you are unlikely to be protected if something goes wrong. Take 2 minutes to learn more
Solana Price Prediction – January 6
Sequencially to the way that bulls in the activities making the transactions between Solana and the valuation of the US coin that have reached a maximal point around the point of $120 in the last uprising motion path, the crypto trade now goes correcting, finding a pivot around the line of the middle Bollinger Band.
Based on current signs, the retracement’s highest further lower potential for completion could be around the $80 support line if it is continuing to extend. It is barely below the lower Bollinger Band trend line, confirming that technical assumption. Investing ideas need to start if that’s anything to go by since it may also result in the process of buying window opportunities.
SOL/USD Market
Key Levels:.
Resistance levels: $125, $130, $135
Support levels: $85, $80, $75
SOL/USD – Daily Chart
The SOL/USD daily chart showcases that the crypto-economic market is correcting after hitting resistance around the point of $120, finding a pivot.
The stochastic oscillators have been on a traversing move that has led them into the oversold region to bring about the thought for bears to be more careful at this point to execute fresh selling orders. The Bollinger Band is yet to be positioned ideally on the north side, creating a crucial support line around the value of $80.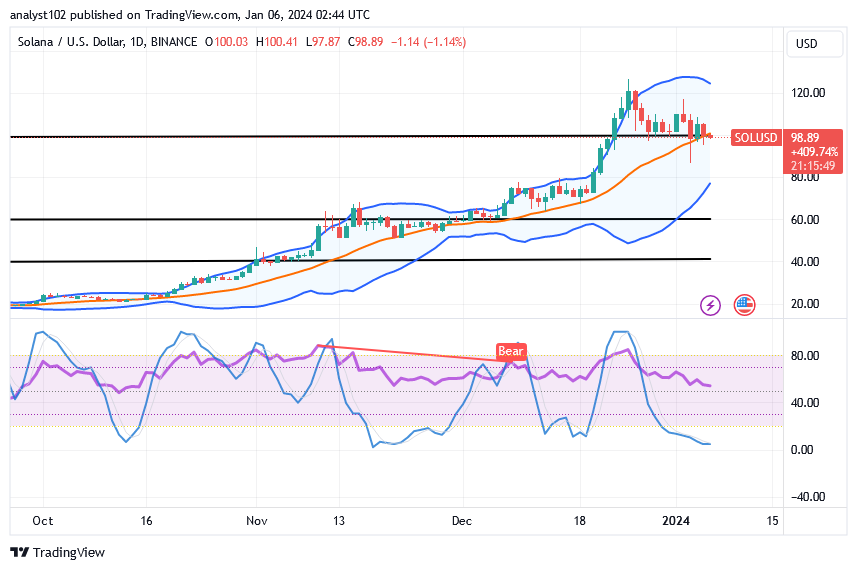
Should sellers continue shorting if the SOL/USD market eventually breaches southward against the $80 line?
An aftermath trading operation that may appear to break further against the support line of $80 will potentially risk a whipsaw session that can in no time lead to seeing that bulls are getting back positively, given that the SOL/USD market currently goes correcting, finding a pivot around the zone of the middle Bollinger Band.
Buyers may be in charge of entry-regaining procedures because the SOL/USD market is currently exhibiting an oversold state trait. Investors may start to reinvest in positional accumulation strategies in the interim. Following a notable decline, long-position placers should align with buy-stop orders to keep up with the vigorous rallying momentum that can emanate.
One could run into the danger of a revisit of support around the lower trend line if there is further falling movement to push below the middle Bollinger Band trend line. Additionally, sellers may find it challenging to comply securely during that move since a rebound is possible.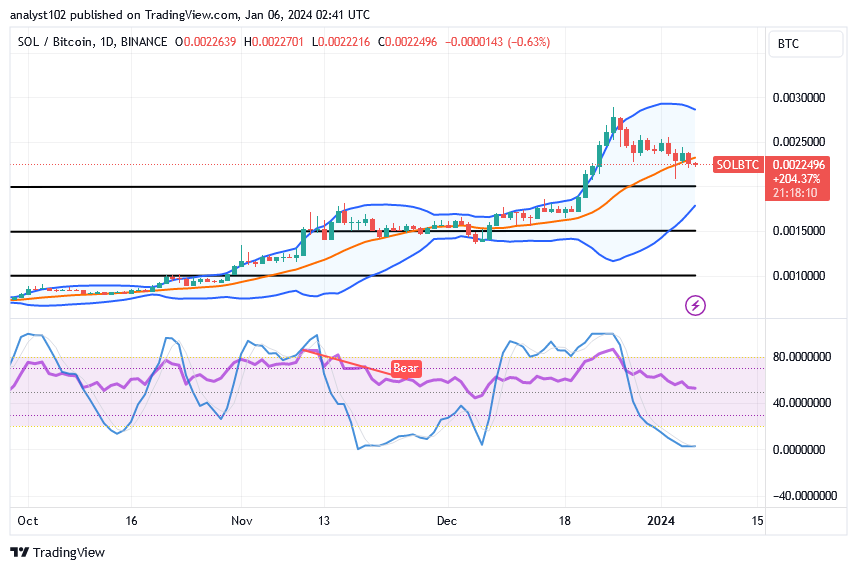
SOL/BTC Price Analysis
In contrast, the Solana market goes correct against the price worth of Bitcoin, finding a pivot around the middle Bollinger Band.
The positioning points of the Bollinger Band indicators have remained rising. That indicates that there will be three more chances for the base cryptocurrency to reclaim its positions while a retracement is given the opportunity to run its whole course. As things stand, the stochastic oscillators have entered the oversold area, suggesting that the countertrade instrument’s capacity has reached a flash level that calls for a warning signal against seeing additional stable reductions.
Note: Cryptosignals.org is not a financial advisor. Do your research before investing your funds in any financial asset or presented product or event. We are not responsible for your investing results.
You can purchase Lucky Block here. Buy LBLOCK