Solana (SOL/USD) Price Reverses, Taking a Step Back Upward
Estimated Reading Time: 3 minutes
Don’t invest unless you’re prepared to lose all the money you invest. This is a high-risk investment and you are unlikely to be protected if something goes wrong. Take 2 minutes to learn more
Solana Price Prediction – December 29
In recent operations, some activities that showed up between buyers and sellers in the market operations of the TAMA/USD occurred steadily to project that the price encountered a resistance around $125 as the crypto-economic trade reversed, taking a step back upward.
As of the writing of this analysis, buyers are probably going to make a strong push back to the north side, which is why a bullish candlestick is forming. The $100 trade milestone will most likely act as the crucial turning point around which the next rallies will build their arguments. Logically, it would be better for buyers to begin returning before the longing positions became fully established.
SOL/USD Market
Key Levels:.
Resistance levels: $125, $130, $135
Support levels: $85, $75, $65
SOL/USD – Daily Chart
The SOL/USD daily chart reveals that the crypto-economic price reverses, taking a step back upward after finding support around the line of $100.
The Bollinger Band trend lines have been positioned around $125 and $50, as the middle trend part is placed northward, nearly reaching the point of $100 from beneath. The stochastic oscillators are in a southbound-crossing mode to signify that the pace that falling force has pushed has gotten exhausted.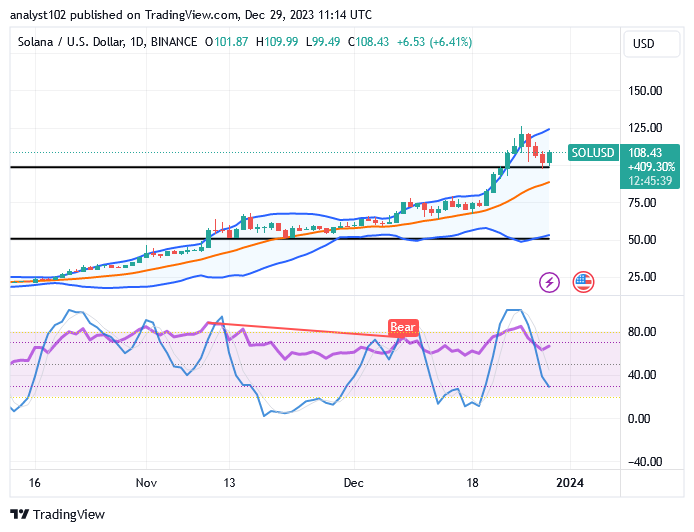
Will the bullish-developing candlestick that is currently in place generate more positive indexes away from the $100 mark?
An instant execution of position order ought to have been taken by long-position takers while the market portends the possibility of being stopped from further fall-offs as the SOL/USD market reverses, taking a step back upward.
Given that the Japanese trading candlestick for today has a bullish appearance and is currently trading near the $100 trade line, it is expected that buyers will pursue steady purchasing positions. To reestablish maximal support, there may yet be a pullback of the upward movements toward averaging the middle Bollinger Band.
Situational pattern to support the likelihood of obtaining respectable sell entries at a higher trading range near the upper trend line of the Bollinger Band. Placers in short positions should not attempt to execute their orders immediately against the current rising gravity. It is advisable that an overbought condition be satisfied prior to reevaluating a sale order.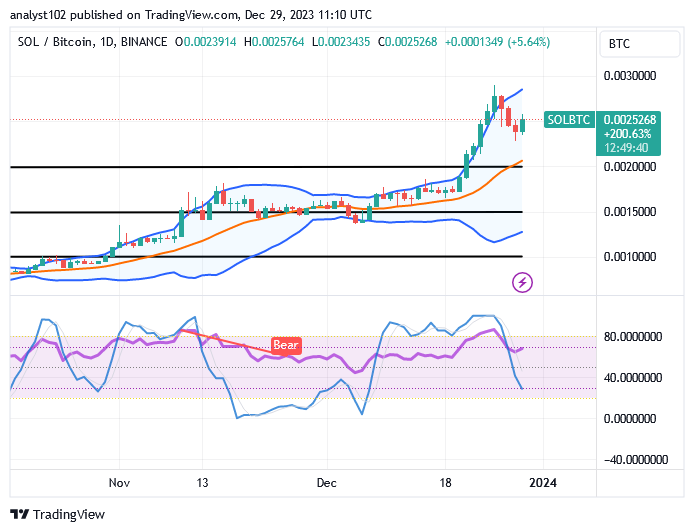
SOL/BTC Price Analysis
In contrast, the Solana trade reverses, succumbing to the weight of Bitcoin and taking a step back upward above the middle Bollinger Band.
In order to move closer to the point of 20, the stochastic oscillators have crossed over to the south. Additionally, the base cryptocurrency will gain momentum against its counter-trading tool when a bullish candlestick forms. On the upper side, the Bollinger Band trend lines have been extending northward. Additionally, it seems to position a shield at a higher point in order to advertise the crucial resistance line that the base cryptocurrency must cross in order to create a stable baseline at a higher point.
Note: Cryptosignals.org is not a financial advisor. Do your research before investing your funds in any financial asset or presented product or event. We are not responsible for your investing results.
You can purchase Lucky Block here. Buy LBLOCK