Lucky Block Price Prediction: LBLOCK/USD Retreats Below $0.000160; Buyers Could Buy the Dips
Estimated Reading Time: 3 minutes
Don’t invest unless you’re prepared to lose all the money you invest. This is a high-risk investment and you are unlikely to be protected if something goes wrong. Take 2 minutes to learn more
Lucky Block Price Prediction – March 24
The Lucky Block price prediction drops below the 9-day moving average; the price becomes cheaper for new buyers to enter.
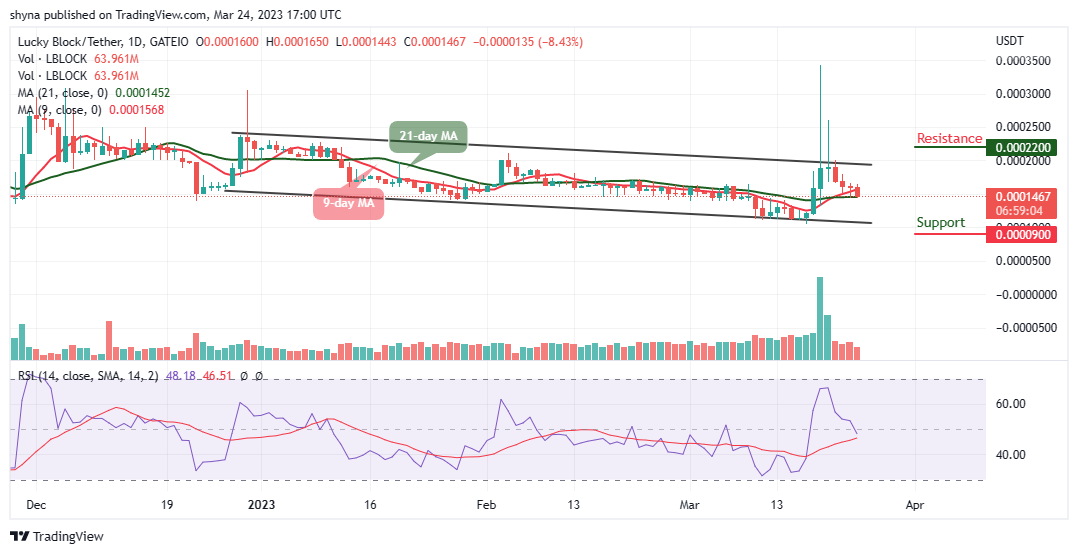
LBLOCK/USD Medium-term Trend: Ranging (1D Chart)
Key Levels:
Resistance levels: $0.000220, $0.000240, $0.000260
Support levels: $0.000090, $0.000070, $0.000050
LBLOCK/USD could be preparing for the next bullish movement as the coin touches the support at $0.000144. This is so important so that the coin could touch the resistance level of $0.000200 and for the existing buyers to buy the dip. Nonetheless, if the sellers bring the market further lower, bears can expect immediate support below the 21-day moving average.
Lucky Block Price Prediction: LBLOCK/USD Could Move for a Retracement
The Lucky Block price consolidates within the 9-day and 21-day moving averages, this could be a good opportunity for the existing buyers to buy the dip should the coin falls more. Moreover, the technical indicator Relative Strength Index (14) crosses below the 50-level. Beneath this, further supports could be found at $0.000090, $0.000070, and $0.000050.
On the contrary, if the buyers hold the current market value and push it to the upside, the bulls can expect a bullish cross above the upper boundary of the channel, and any further positive movement could hit the resistance levels at $0.000220, $0.000240, and $0.0002600.
LBLOCK/USD Medium-term Trend: Ranging (4H Chart)
On the 4-hour chart, the Lucky Block (LBLOCK) continues to consolidate below the 9-day and 21-day moving averages, the coin is likely to cross below the lower boundary of the channel, which could give the new and existing buyers to invest more.
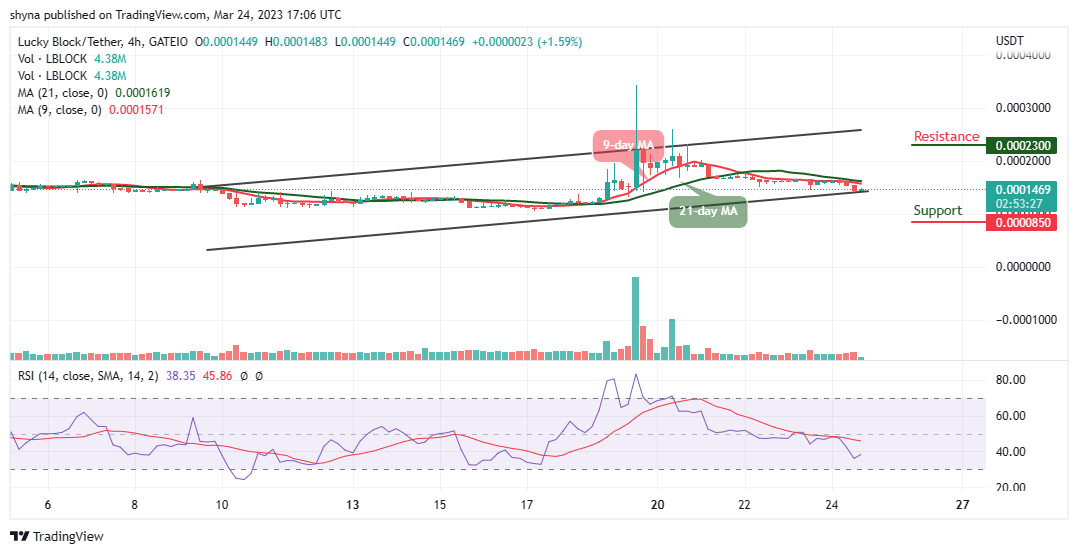
From above, buyers are gaining momentum and they are ready to push the market price above the moving averages. However, any further bullish movement could touch the resistance level of $0.000230 and above. Meanwhile, if the coin slide below the lower boundary of the channel, it could touch the support level at $0.000085 and below while the technical indicator Relative Strength Index (14) moves to cross above the 40-level.
You can purchase Lucky Block here. Buy LBLOCK