Chainlink (LINK/USDT) Uptrend Strengthens Amid Breakout
Estimated Reading Time: 3 minutes
Don’t invest unless you’re prepared to lose all the money you invest. This is a high-risk investment and you are unlikely to be protected if something goes wrong. Take 2 minutes to learn more

The market for ChainLink against Tether saw a 2.52% rise in the last 24 hours, performing better than the broader crypto market’s modest 0.25% gain. At the moment, the most noticeable driver of this growth can be linked to Grayscale’s LINK ETF (GLNK), attracting $64 million in inflows. This signals improved institutional concerns and reflection of increasing confidence in LINK as an investment asset.
Additionally, the pair’s technical indicators in recent times are pointing to further growth potential as the pair appears to be forming a falling wedge pattern, a typical bullish pattern. Furthermore, the about 17% decline in LINK’s exchange reserves in November appears to have impacted supply, creating a favorable environment for a potential improvement.
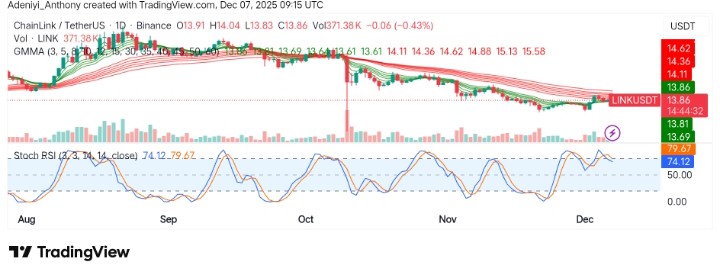
As it stands, ChainLink trades at $13.86 with more than 371,000 volumes on the daily chart.
Technical Indicators
Major Resistance Levels: $14.50, $15.00, and $17.00
Major Support Levels: $13.70, $13.00, and $12.05
Technical Analysis
The analysis of ChainLink against Tether on the daily timeframe typically displays a strong upward signal, especially with the movement of the Guppy Multiple Moving Averages (GMMA). The convergence of the short-period EMAs towards the long-period EMAs suggests a continued bullish improvement.
However, the Stochastic RSI appears to be pointing to the south despite positioning at a favorable level for an improved bullish build-up. This signals caution for a short-term move to the south even amidst reduced selling pressure.
Update About ChainLink
On the hourly timeframe, ChainLink is currently experiencing a bounce, extending to the top within the ABC structure. However, the price is still acting under the prescribed $14 and $17 resistance.
As it stands, there could be a rejection around $14.12 and $14.75, as the pullback in the previous month may not be enough for an upside move.
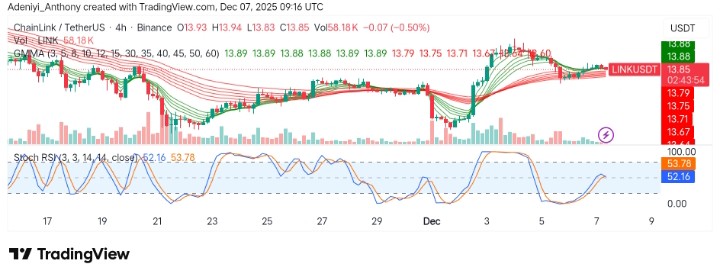
LINK/USDT Analysis: Facing Short-term Resistance
On the 4-hour chart, LINK/USDT seems to be consolidating after its recent push higher. The GMMA is still displaying a bullish stance despite the closeness of the sets of the EMAs. However, the momentum oscillator is giving a bearish signal, suggesting a pause on the pair’s bullish track.
To this end, the immediate support is at $13.70, and a break above would indicate a move towards $14.50; otherwise, a break below would necessitate a move back into the $12.00 zone. Meanwhile, the current structure reflects a balanced pressure between the bulls and bears in the short term.
You can purchase crypto coins here. Buy crypto