Chainlink (LINK/USDT) Shows Early Bottoming Signs as Overbought Momentum Suggests Pullback
Estimated Reading Time: 3 minutes
Don’t invest unless you’re prepared to lose all the money you invest. This is a high-risk investment and you are unlikely to be protected if something goes wrong. Take 2 minutes to learn more

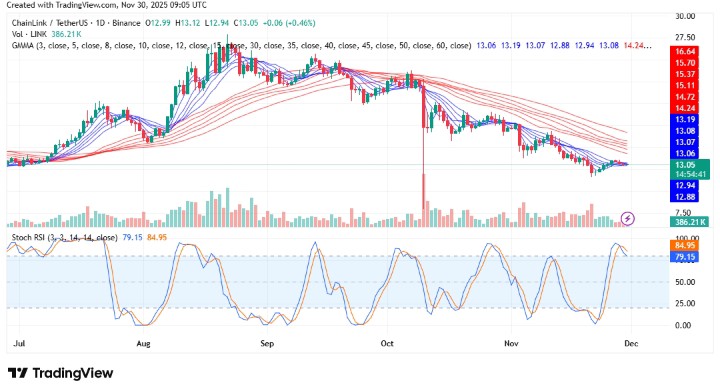
I’mChainlink against Tether on the daily timeframe has been in a multi-week downtrend after peaking earlier. The price appears to be sliding consistently beneath the long-term Guppy Multiple Moving Averages (GMMA). However, bullish attempts have emerged, pushing the price slightly upward from a local bottom and nudging at the underside of the shorter EMAs.
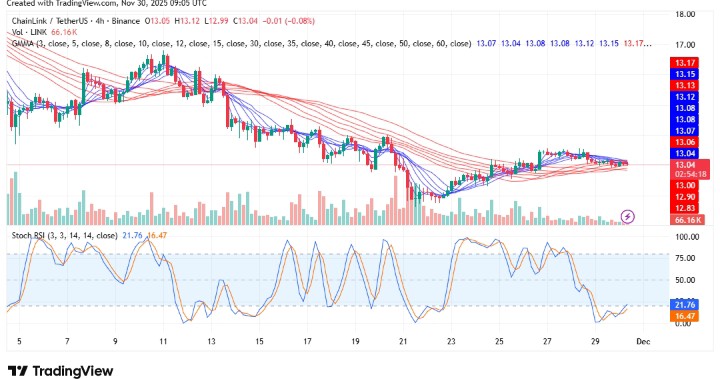
Meanwhile, on the shorter timeframe, LINK is compressing into a tight consolidation range after an extended multi-week decline, reflecting weakening bearish momentum.
Currently, Chainlink trades at $13.05 with more than 386,000 traded volumes for the day
Technical Indicators
Major Resistance Levels: $13.15, $14.24, and $15.15
Major Support Levels: $13.00, $12.50, and $11.30
Technical Analysis
Technically, the market for Chainlink against Tether appears to be moving in a tight space; the price seems to be operating underneath some sets of exponential moving averages that are slightly spread and angled downward. This confirms a dominant downtrend even as the short-period EMAs hint at an early-stage bottoming action.
Meanwhile, the Stochastic RSI with an overbought condition suggests exhaustion in the current momentum as the volume displays mixed momentum. This indicates accumulated interest, but a trend reversal is yet to be confirmed.
To this end, if the $14.24 resistance line is unbroken, a reversal to the upside can not be recorded, and a continued downtrend may be spotted.
Understanding Chainlink’s Movement
Chainlink is still stuck under a long-term downward yellow trend line around $13.50. After a recent bounce, the price is now pulling back, and the key area to watch is the support zone between $12 and $12.78, which comes from a common Fibonacci retracement level. As long as LINK stays above last week’s low at $11.58, the uptrend idea is still possible.
Meanwhile, the pullback so far looks like a normal three-wave correction (ABC), which can often happen before another move up, but there’s still no clear sign the drop is finished. To this end, if the price reacts strongly in the support zone and then breaks above the yellow trend line and levels near $14–$14.50, that would give stronger evidence of a real trend reversal.
LINK/USDT Analysis: Momentum Begins to Turn Upward
On the 4-hour chart, LINK/USDT appears to be displaying mixed sentiment, as both short-period and long-period EMAs remain flattened and closed but without a crossover. This suggests the market is currently balanced, with bears’ strength waning.
However, the momentum oscillator is signaling rising momentum in the coming session, but the bulls are yet to take control despite the impulsive stance displayed by the volume bar. To this end, until the $13.17 line, the market remains bearish.
You can purchase crypto coins here. Buy Crypto