Polkadot (DOT) Retraces To $28 Support As Buyers Recoup To Resume Up Trending
Estimated Reading Time: 2 minutes
Don’t invest unless you’re prepared to lose all the money you invest. This is a high-risk investment and you are unlikely to be protected if something goes wrong. Take 2 minutes to learn more
Polkadot (DOT) Long-Term Analysis: Bullish
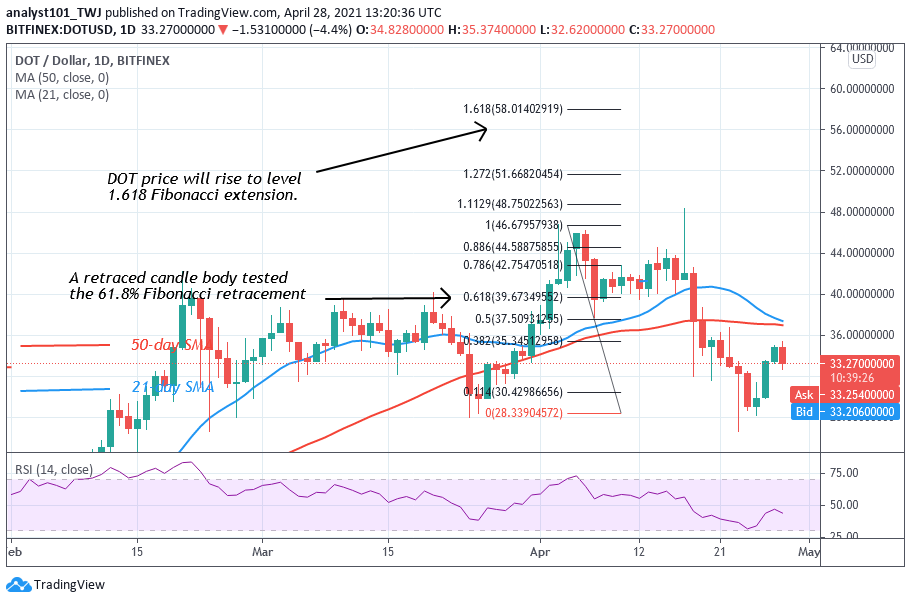
Polkadot (DOT) has fallen and found support above the $28 support on April 24. The $28 support level was the previous price level of March 24. On March 24, DOT price rallied to $45 high but was resisted. On April 4 uptrend, a retraced candle body tested the 61.8% Fibonacci retracement level. The retracement implies that DOT will rise to level 1.618 Fibonacci extension or $58.01.
Polkadot (DOT) Indicator Analysis
The crypto is at level 44 of the Relative Strength Index period 14. It indicates that the market is in the downtrend zone below the centerline 50. The 21-day and 50-day SMAs are sloping upward indicating the previous uptrend.
Technical indicators:
Major Resistance Levels – $48, $52, $56
Major Support Levels – $32, $28, $24
What Is the Next Direction for Polkadot (DOT)?
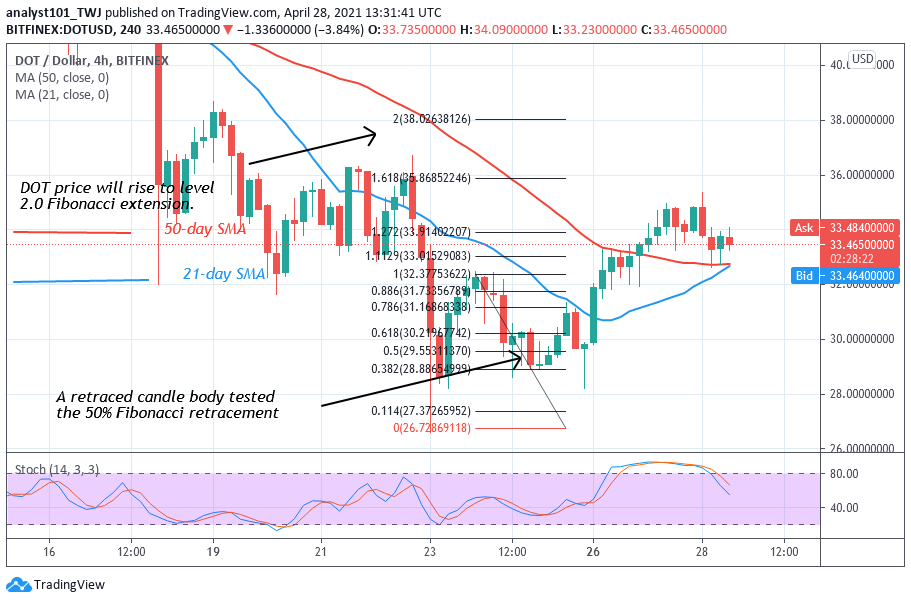
On the 4 hour chart, Polkadot resumed an upward move after the exhaustion of the bearish trend. The uptrend resumed above the $28 support and rallied to $32 but pulled back to $28.90 before finally resuming upward. Meanwhile, on April 23 uptrend, a retraced candle body tested the 50% Fibonacci retracement level. This retracement implies that DOT will rise to level 2.0 Fibonacci extensions or the high of $38.02.
Note: cryptosignals.org is not a financial advisor. Do your research before investing your funds in any financial asset or presented product or event. We are not responsible for your investing results