Polkadot Reaches the Overbought at $20.65, May Face Rejection at Recent High
Estimated Reading Time: 3 minutes
Don’t invest unless you’re prepared to lose all the money you invest. This is a high-risk investment and you are unlikely to be protected if something goes wrong. Take 2 minutes to learn more


Free Crypto Signals Channel

Polkadot (DOT) Long-Term Analysis: Bullish
Polkadot’s (DOT) price is trading in the bullish trend zone but may face rejection at recent high. The price indicators are showing that the altcoin is approaching the overbought region of the market. Besides, the current uptrend is likely to face resistance at the $23 high. These factors will contribute to the decline of Polkadot. On the upside, if the bulls break above the $23 resistance, the bullish momentum will extend to the high of $30. Conversely, if the altcoin turns from the $23 resistance, DOT/USD will decline above the moving averages. The uptrend will resume if the altcoin holds above the moving averages. Nonetheless, if price breaks below the moving averages, the market will decline to $16 low.
Polkadot (DOT) Indicator Analysis
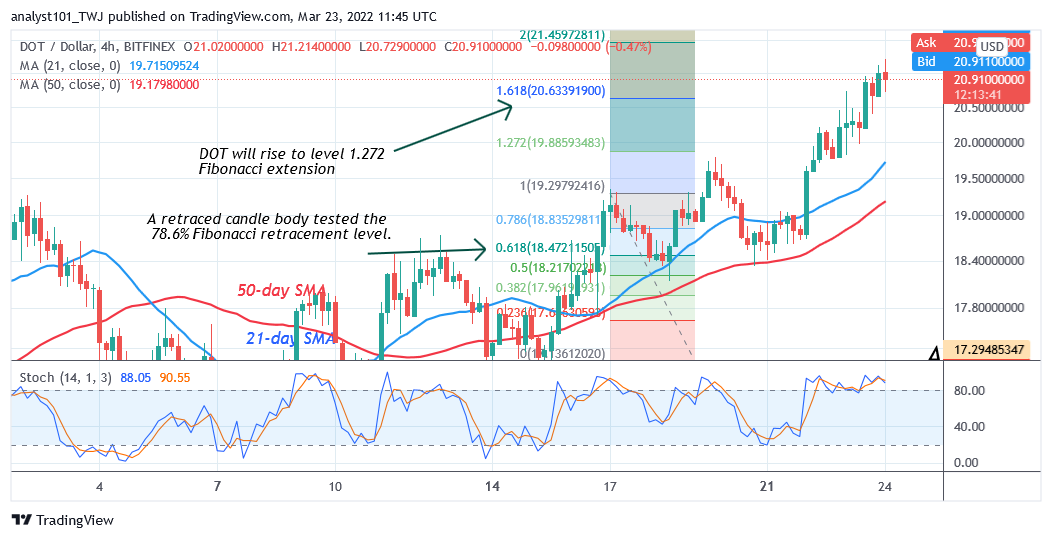
DOT price is at level 63 of the Relative Strength Index period 14. The market is approaching the overbought region. The uptrend will soon reach bullish exhaustion. The altcoin is above the 80% range of the daily stochastic. DOT price has reached the overbought region of the market. Sellers will emerge in the overbought region. DOT’s price is above the 50-day line SMA and the 21-day line SMA indicating the uptrend.
Technical indicators:
Major Resistance Levels – $48, $52, $56
Major Support Levels – $32, $28, $24
What Is the Next Direction for Polkadot (DOT)?
DOT/USD has resumed an uptrend as the market reached the high of $21 but may face rejection at recent high. The cryptocurrency is out of downward correction. Meanwhile, on March 17 uptrend; a retraced candle body tested the 61.8% Fibonacci retracement level. The retracement suggests that DOT will rise to level 1.618 Fibonacci extension or level $20.63. From the price action, the altcoin has reached level 1.618 Fibonacci extension.
.
You can purchase crypto coins here. Buy LBlock
Note: Cryptosignals.org is not a 1a financial advisor. Do your research before investing your funds in any financial asset or presented product or event. We are not responsible for your investing results