Ripple Bounces above Previous Support but Risks Decline below $0.41
Estimated Reading Time: 2 minutes
Don’t invest unless you’re prepared to lose all the money you invest. This is a high-risk investment and you are unlikely to be protected if something goes wrong. Take 2 minutes to learn more

Free Crypto Signals Channel
Ripple (XRP) Long-Term Analysis: Bearish
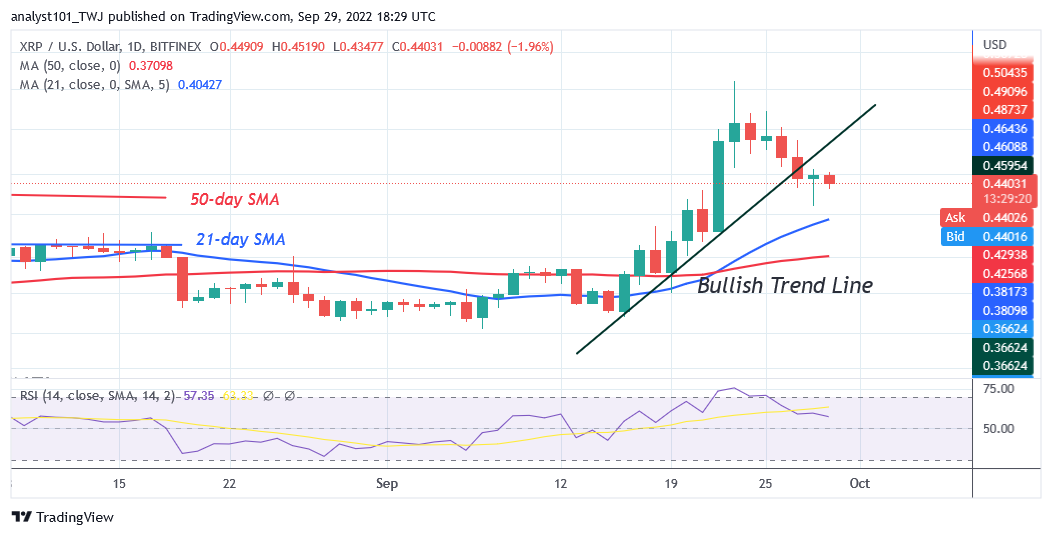
Ripple’s (XRP) price is in the bullish trend zone but risks decline below $0.41. The cryptocurrency faces selling pressure as it reaches the overbought region of the market. The selling pressure will persist if price breaks below the moving average lines. Also, XRP will revisit the current support at $0.32 if price breaks below the moving average lines. On the upside, the uptrend will resume, if price retraces and finds support above the moving average lines. Presently, the XRP price has fallen to the low of $0.44 at the time of writing.
Ripple (XRP) Indicator Analysis
XRP is at level 57 of the Relative Strength Index for period 14. It indicates that XRP is in the bullish trend zone despite the retracement. The price bars are above the moving average lines which indicates a further upward move. The altcoin is below the 40% range of the daily stochastic. It indicates that the market is in a bearish momentum.
Technical indicators:
Major Resistance Levels – $0.80, $1.00, $1.20
Major Support Levels – $0.60, $0.40, $0.20
What Is the Next Direction for Ripple (XRP)?
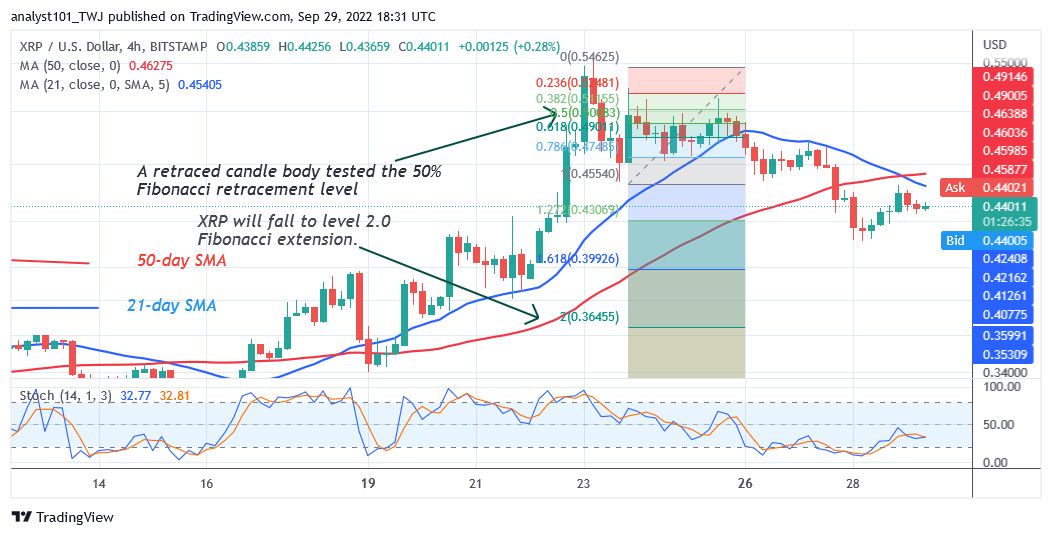
On the 4-hour chart, Ripple is in a downtrend as it risks decline below $0.41. Presently, it is making an upward correction after falling to the low of $ 0.41. Meanwhile, on September 23 downtrend; a retraced candle body tested the 50% Fibonacci retracement level. The retracement suggests that XRP will fall to level 2.0 Fibonacci extension or $0.36 high.
You can purchase crypto coins here. Buy LBLOCK
Note: Cryptosignals.org is not a 1a financial advisor. Do your research before investing your funds in any financial asset or presented product or event. We are not responsible for your investing results