Polkadot Rebounds as It Reclaims the $19 Resistance
Estimated Reading Time: 2 minutes
Don’t invest unless you’re prepared to lose all the money you invest. This is a high-risk investment and you are unlikely to be protected if something goes wrong. Take 2 minutes to learn more

Free Crypto Signals Channel

Polkadot (DOT) Long-Term Analysis: Bullish
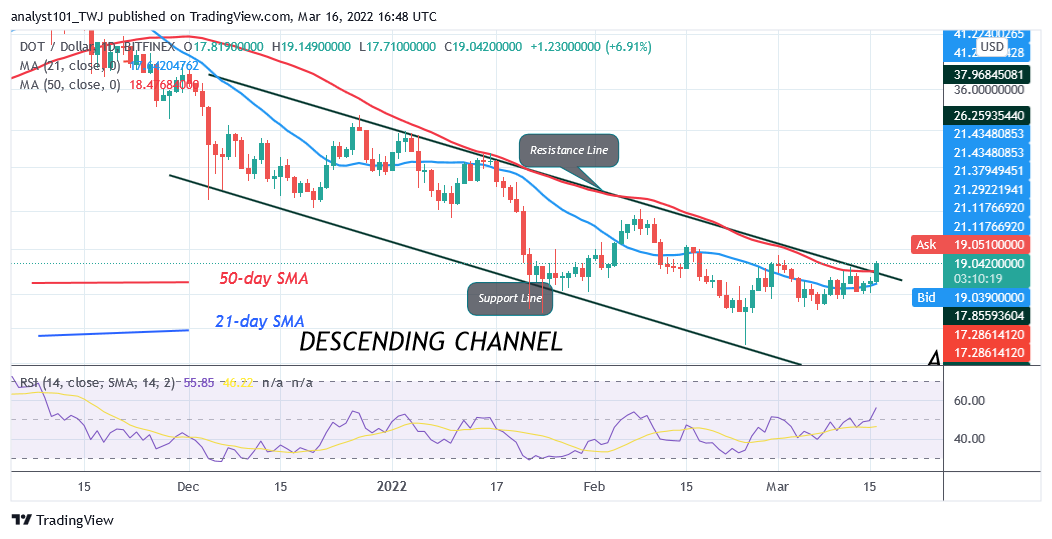
Polkadot’s (DOT) price rebounds as it reclaims the $19 resistance .The altcoin is retesting the initial resistance at $19. The upward movement will continue if the bulls break the initial resistance at $19. Polkadot will continue to rise as long as the price bars are above the moving averages. The selling pressure has subsided as bulls reclaim the $19 high. If the bullish momentum continues and extends above $22, Polkadot will be out of a downward correction.
Polkadot (DOT) Indicator Analysis
DOT’s price is above the 50-day line SMA and the 21-day line SMA indicating a possible rise of the cryptocurrency. The altcoin is at level 56 of the Relative Strength Index period 14. The cryptocurrency is in the uptrend zone and capable of a further upward move. The altcoin is above the 80% range of the daily stochastic. DOT/USD has reached the overbought region of the market.
Technical indicators:
Major Resistance Levels – $48, $52, $56
Major Support Levels – $32, $28, $24
What Is the Next Direction for Polkadot (DOT)?
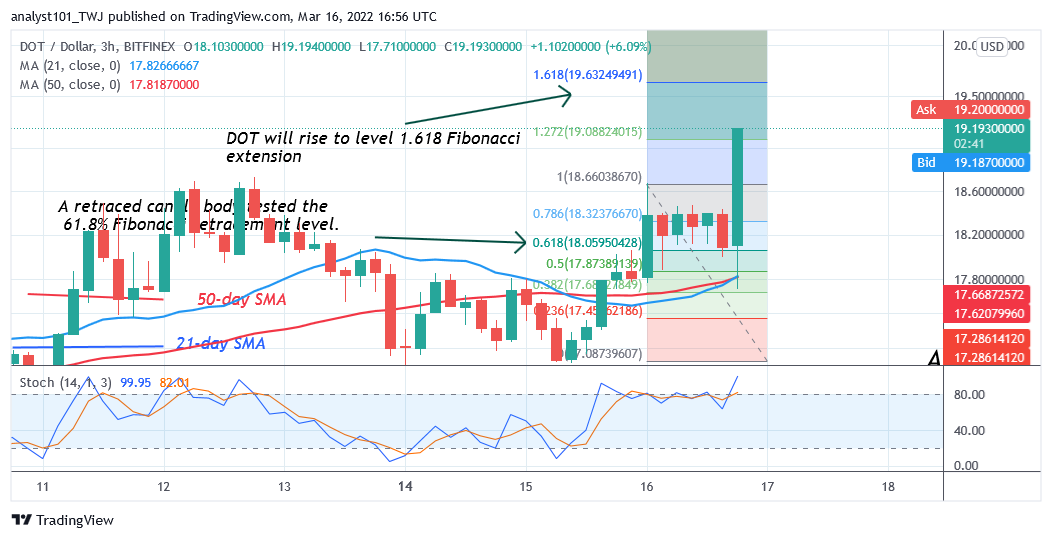
On the 4 –hour chart, DOT/USD is in an upward move as it reclaims the $19 resistance. The current uptrend has reached the overbought region of the market. Meanwhile, on March 16 uptrend; a retraced candle body tested the 61.8% Fibonacci retracement level. The retracement suggests that DOT will rise to level 1.618 Fibonacci extension or level $19.63. From the price action, the altcoin has broken above the $19 resistance.
.
You can purchase crypto coins here. Buy LBlock
Note: Cryptosignals.org is not a 1a financial advisor. Do your research before investing your funds in any financial asset or presented product or event. We are not responsible for your investing results