Polkadot (DOT/USDT) Seeks to Break Above the $4.7526
Estimated Reading Time: 3 minutes
Don’t invest unless you’re prepared to lose all the money you invest. This is a high-risk investment and you are unlikely to be protected if something goes wrong. Take 2 minutes to learn more
DOT Long-term Analysis: Bearish
The general sentiment for Polkadot against the Tether in recent weeks appears cautiously bearish with signs of an upside recovery on the horizon. DOT has shown a downtrend from the beginning of 2024 after hitting a notable height.
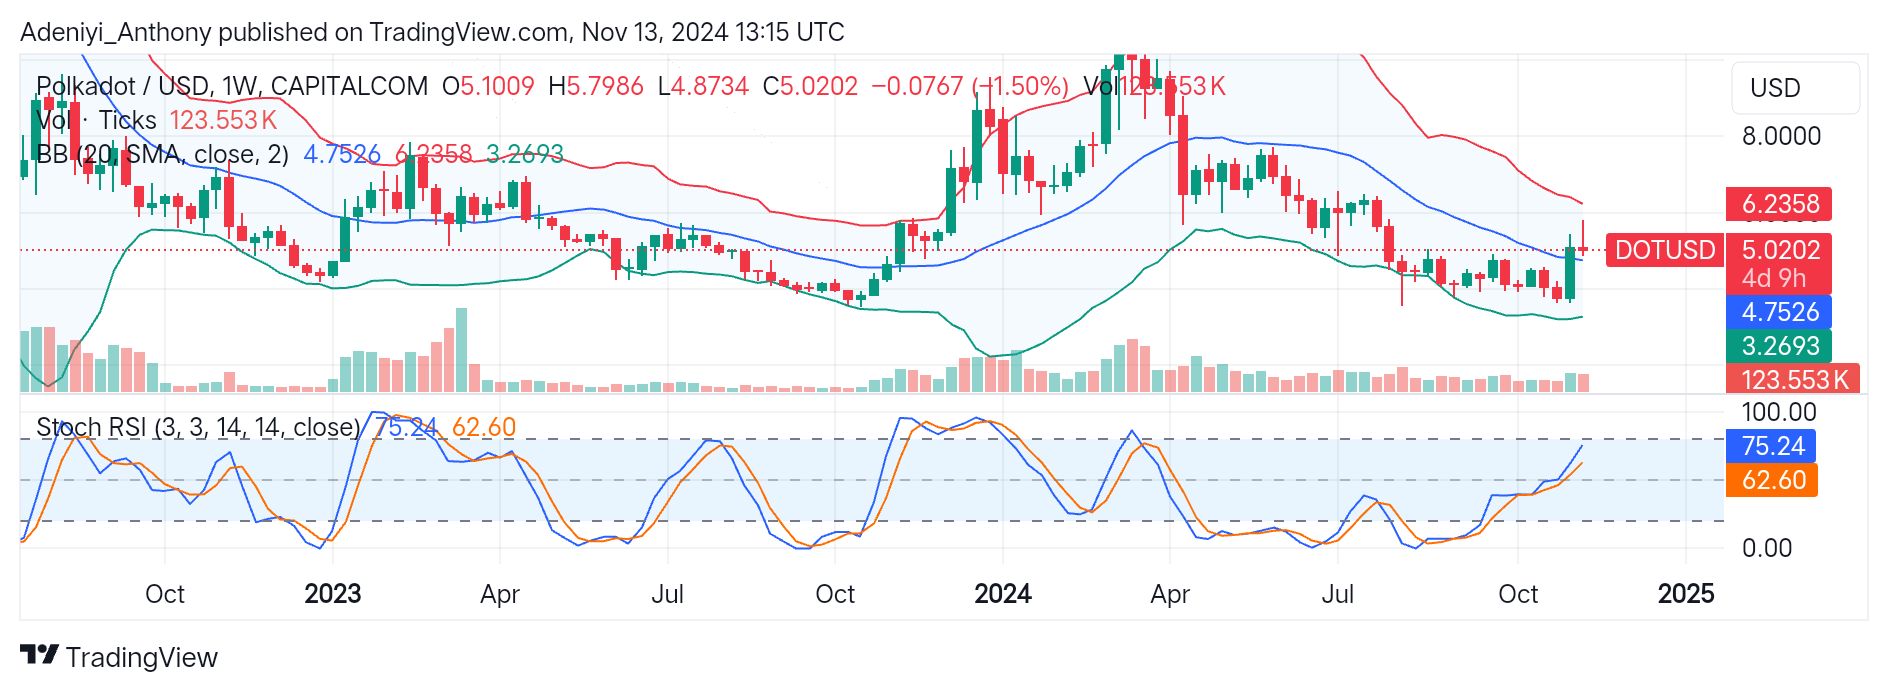
The recent price movement of DOT/USDT shows that the pair is attempting to stabilize above the mid-band around $4.7526 after bouncing off the lower band. Moreover, the current price movement suggests DOT is down by 1.50%, indicating bearish pressure in the market. Despite the current positioning of the price above the middle Bollinger band and the near-overbought condition of the Stochastic RSI, the oscillator reflects the potential for an upside recovery in the near term.
Currently, the pair trades within a conscript Bollinger band at $5.0202 with a low trading volume of 123.53K.
Technical Indicator
Major Resistance Levels: $5.500, $6.2358, and $8.000
Major Support Levels: $4.7526, $3.2693, and $2.000
Polkadot Technical Analysis
The analysis of Polkadot against the Tether on a weekly timeframe suggests the pair is attempting to break above the mid-band while facing serious selling pressure. However, the tightened Bollinger bands suggest an impending breakout and the possibility for trend reversal if DOT successfully breaks above the current price level. Conversely, the pair may see a downtrend if the selling pressure increases.
On the other hand, the Stochastic RSI suggests a near-overbought condition. However, with strong momentum, DOT could challenge the $5.500 level, and a break above this level would indicate the potential for a sustained uptrend. Conversely, a crossover of the lines at this level could see price retesting lower support levels.
DOT/USDT Analysis: Expectations
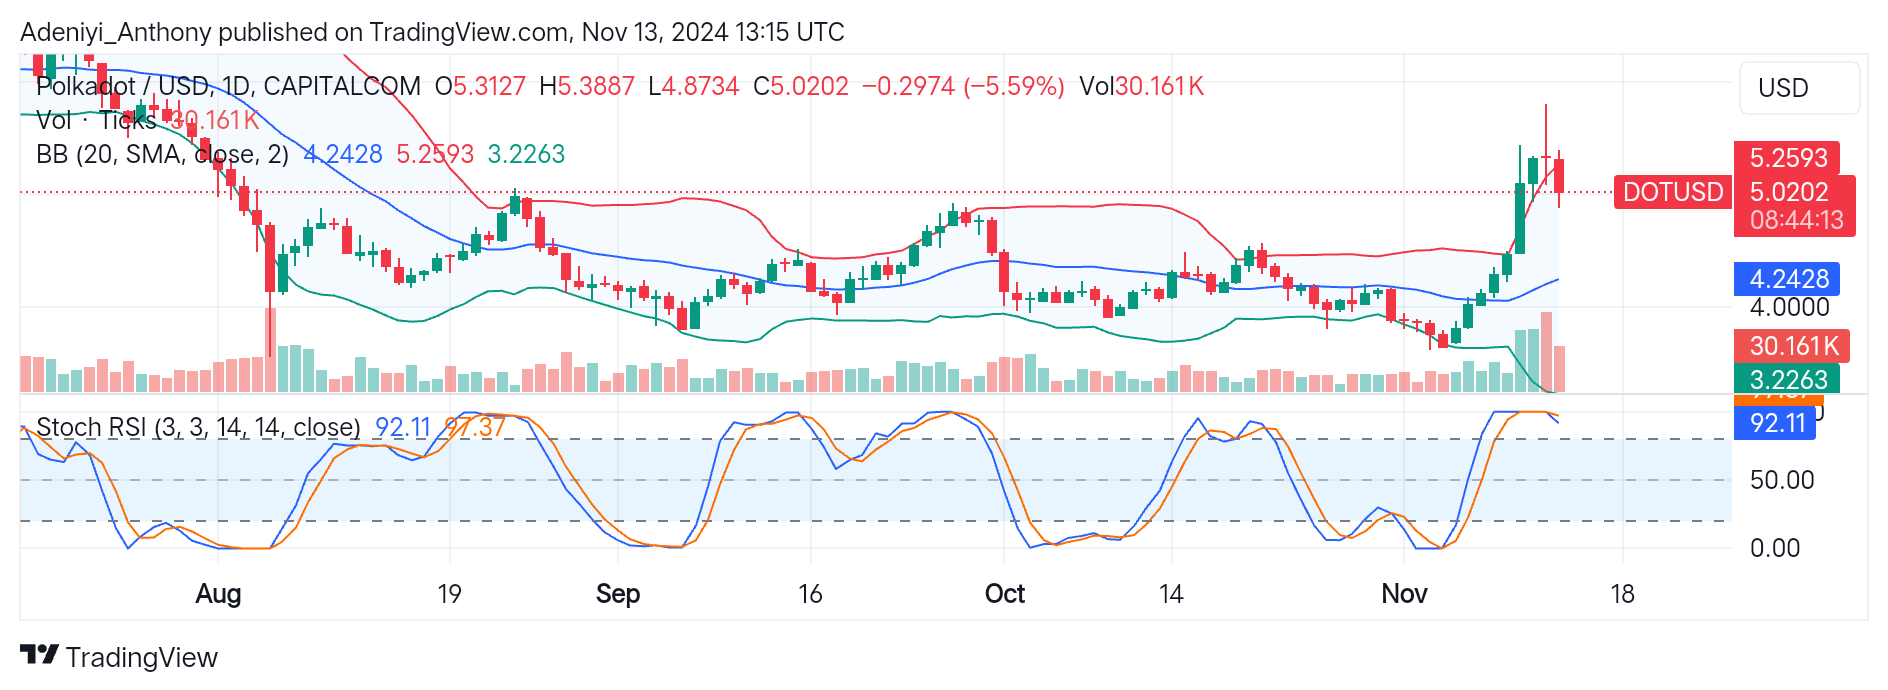
The daily analysis of the DOT/USDT shows a strong bullish sentiment as indicated by the behavior of the price above the upper band. This upward trend reflects a strong buying interest. Moreover, the recent price movement from $5.3902 to $5.0202 suggests that the bears are currently halting the bullish rally with a 5.59% dip in price, leaving the pair to consolidate at the $5 level.
The Bollinger bands are expanding, typically suggesting increased volatility. Also, at the bottom of the chart, the Stochastic RSI pictures an overbought condition, signaling a near-term pullback or a consolidation phase.
However, for a sustained bullish trend, DOT must maintain its current $5 level by challenging the immediate resistance at $5.2593. Therefore, a break below this level towards the mid-band could lead to a downtrend, which may create more buying opportunities if the price breaks above the mid-band.
You can purchase crypto coins here. Buy LBlock