Polkadot (DOT/USDT) Consolidates Around the $3.961 Level
Estimated Reading Time: 3 minutes
Don’t invest unless you’re prepared to lose all the money you invest. This is a high-risk investment and you are unlikely to be protected if something goes wrong. Take 2 minutes to learn more
DOT/USDT Long-term Analysis: Bearish
In recent weeks, DOT/USDT has shown mixed signals amid general market uncertainty. Polkadot has encountered resistance around key levels and has seen both bullish and bearish pressure, as seen in the formation of lower highs and lows.
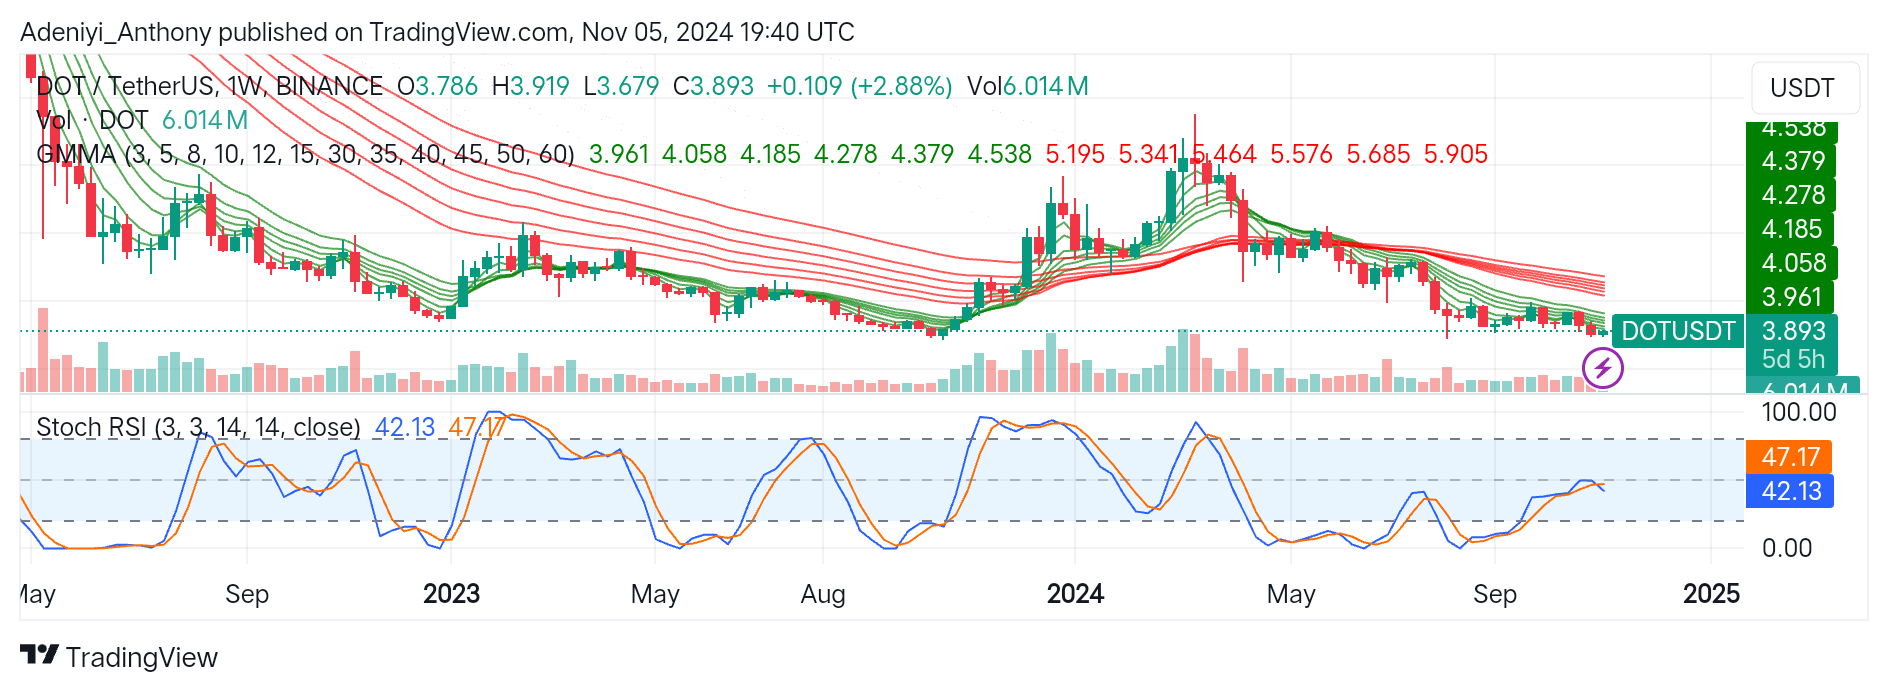
Currently, it looks like the price is gearing up for an upside movement with the recent consolidating actions around the $3.961 level. However, the positioning of the pair below the Guppy Multiple Moving Average (GMMA) and the formation of the averages suggest the pair is under strong bearish pressure.
DOT/USDT is currently trading at $3.893, with a modest increase of 2.88%, yet the positioning of the green GMMA may dictate the near-term trajectory.
Technical Indicator
Major Resistance Levels: $4.058, $4.185, and $4.538
Major Support Levels: $3.679, $3.500, and $3.200
Polkadot Technical Analysis
Polkadot has seen a strong downtrend recently, as evident in the downward-sloping GMMA. The recent consolidation and the formation of the bullish candlestick suggest an upside trajectory is on the horizon. However, for strong upside moves, the averages must converge with a strong trading volume, with the price breaking above $4.538. Conversely, there may be a price dip if the pair breaks below the current level.
On the downside of the chart, the Stochastic RSI suggests the pair is in a neutral position, indicating that a move in either direction is possible. A curve to the upside of the chart may signal renewed buying interest, while the opposite might indicates the continuation of the long-term trend.
However, traders should keep an eye on the volume and the Stochastic movement for clearer signals on DOT directional movement.
DOT/USDT Analysis: Where from Here?
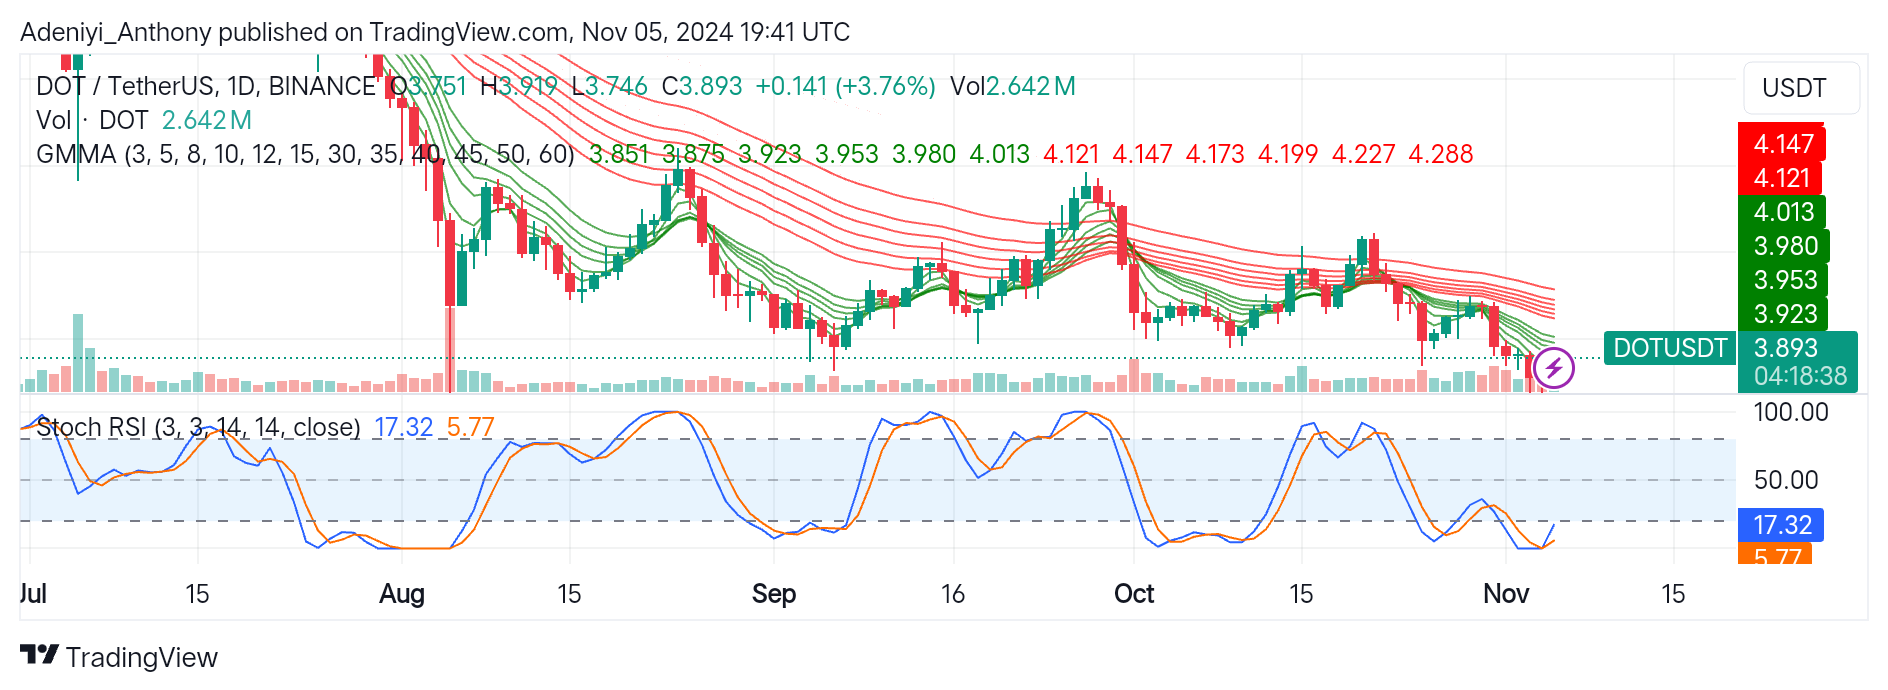
On the daily timeframe, DOT/USDT is still trading below the GMMA. This suggests that the overall market sentiment remains bearish with the red averages above the green set of averages.
As suggested by the GMMA, the immediate resistances lie at $3.923 and $3.953. A break above these levels could see the pair test a higher resistance level. Conversely, with the immediate support level at $3.746; a fall below this level may lead to further downturns.
On the downside of the chart, the Stochastic RSI suggests the pair is in the oversold region. This implies that DOT/USDT may be due for upside reversal soon as the current low may attract bullish interest.
However, if the support at the $3.746 level holds, a move above the $3.953 could cement the bullish reversal; otherwise, the pair may continue the downtrend.
You can purchase crypto coins here. Buy LBlock