Polkadot (DOT/USDT) Consolidates Near a Critical Point
Estimated Reading Time: 3 minutes
Don’t invest unless you’re prepared to lose all the money you invest. This is a high-risk investment and you are unlikely to be protected if something goes wrong. Take 2 minutes to learn more
DOT/USDT Long-term Analysis: Bearish
The current Polkadot (DOT) market has been close to an important point after a prolonged downtrend. In the past few weeks, DOT/USDT has seen a minor upward trajectory, which indicates bullish momentum is beginning to build up.
Though the DOT market has seen some volatility in the general sense, the recent price actions around key support areas suggest stability. This indicates a breakout is on the horizon as the price consolidates within a narrow range, with signs of a potential uptrend.
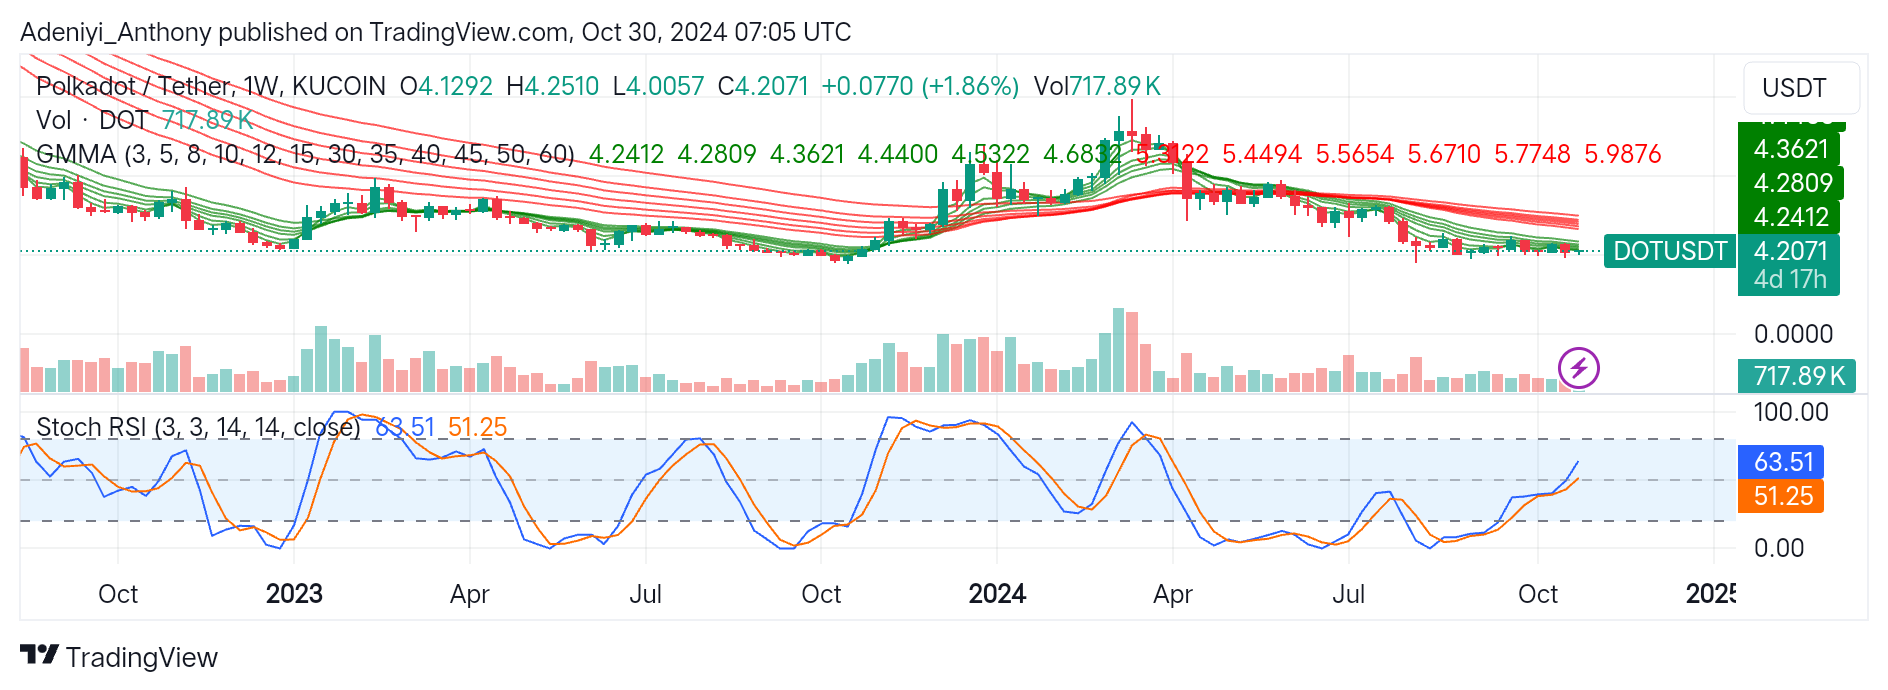
Currently, the Polkadot is valued at $4.2071, with a 1.86% positive difference from the previous session.
DOT/USDT Technical Indicators
Major Resistance Levels: $4.500, $5.000, and $5.500
Major Support Levels: $4.000, and $3.700, and $3.500
Polkadot Technical Analysis
Polkadot against the Tether on the weekly timeframe has been declining over time. The slight convergence of the green GMMA (Guppy Multiple Moving Averages) suggests the possible start of a new trend. However, the investors’ averages are still trending downward; this suggests the market needs more bullish pressure for a confirmed reversal.
For confirmation of a bullish reversal, the price of the pair must break above the $4.50 level; otherwise, a break below $4.00 may indicate a continued downtrend.
The Stochastic RSI below the chart suggests DOT/USDT is moving from the oversold regions, with the blue line above the orange line. However, the current levels of the lines indicate that the upward momentum might still be in its early stages.
DOT/USDT Analysis: What to Expect
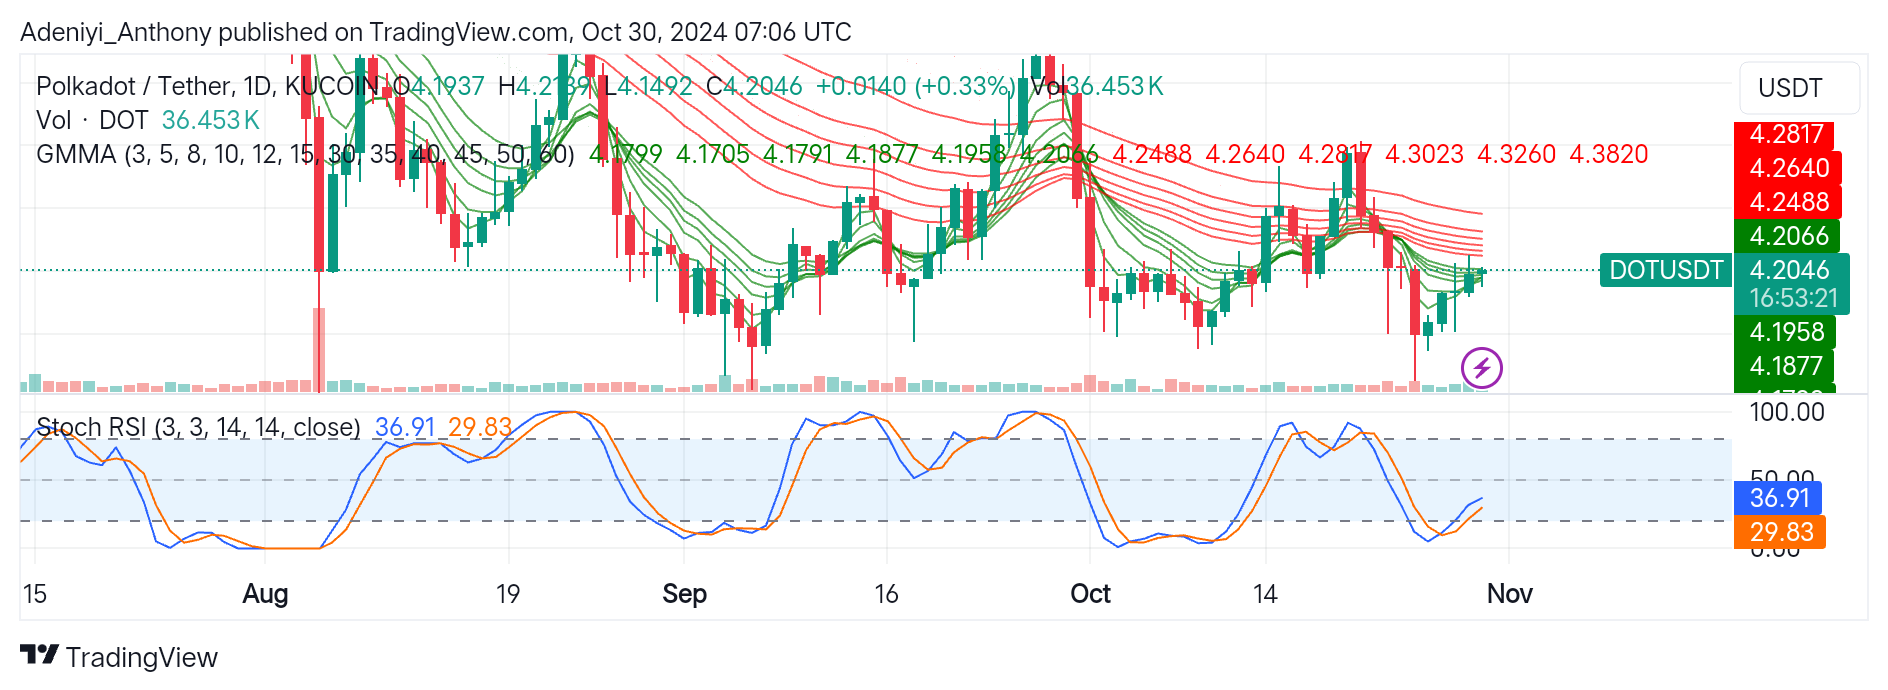
On the daily timeframe, DOT/USDT has shown some minor market gains, but the overall market outlook is still bearish at $4.2046. The GMMA shows signs of convergence towards one another, indicating that if current buying pressure persists, there might be a crossover soon. This condition signals a trend reversal or, at worse, a short consolidation phase. However, this condition will be possible if the price in this timeframe hits above $4.2500; otherwise, a break below $4.1800 would signal a continued downtrend.
The Stochastic oscillator at the bottom of the chart suggests the pair is beginning to shift further away from the oversold region, which indicates bullish momentum is building up. However, since these build-ups are still below the 50% level, there is room for more improvement, but a reversal of these lines would signal halt the bullish formation.
You can purchase crypto coins here. Buy LBlock