Polkadot (DOT/USDT) Shows Signs of Potential Breakout
Estimated Reading Time: 3 minutes
Don’t invest unless you’re prepared to lose all the money you invest. This is a high-risk investment and you are unlikely to be protected if something goes wrong. Take 2 minutes to learn more
Polkadot Long-term Analysis: Bearish
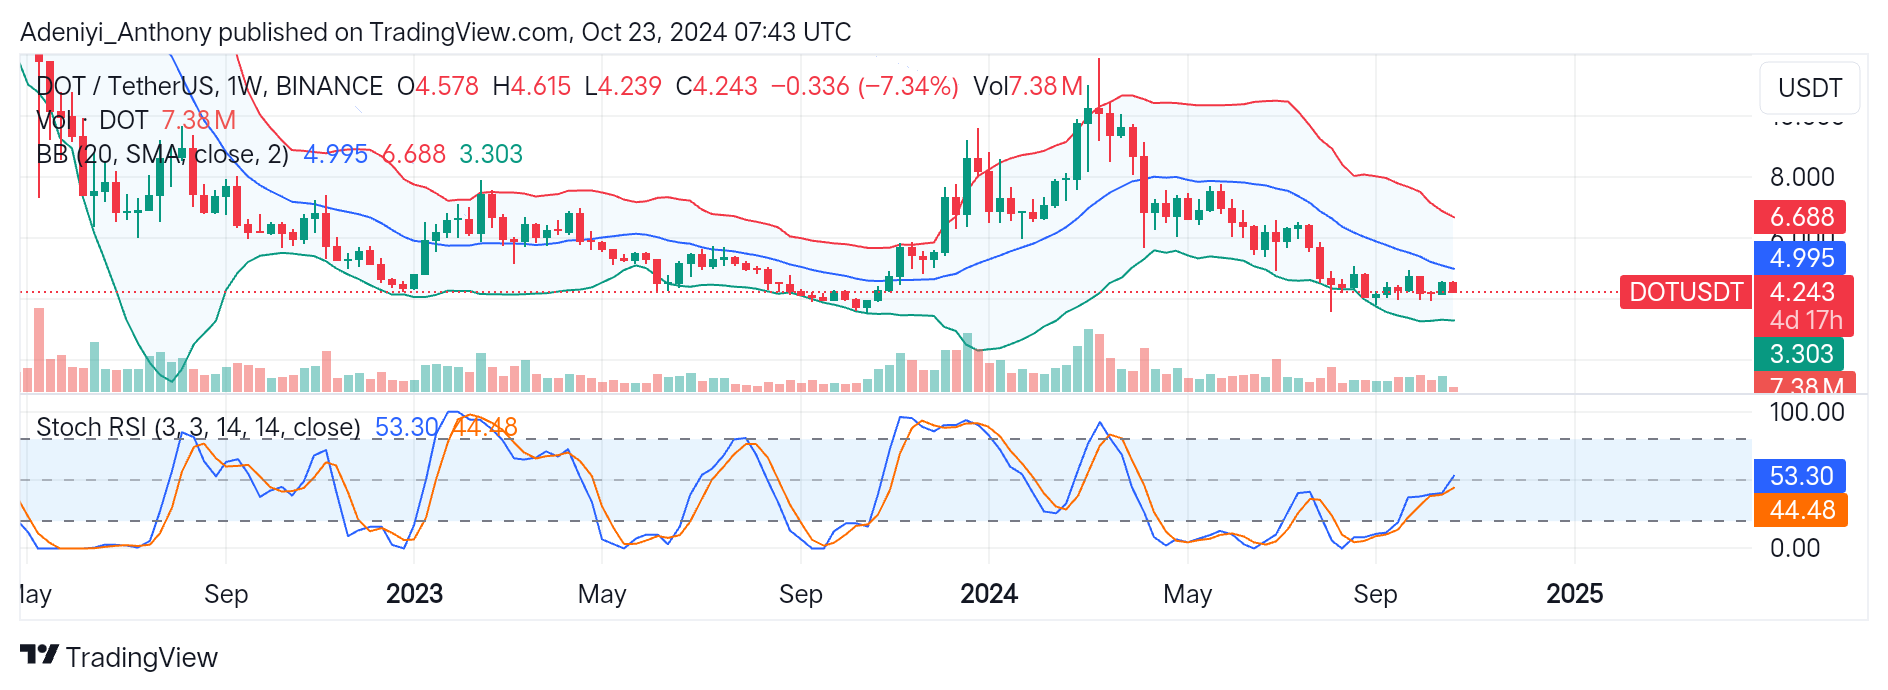
The analysis of Polkadot against the Tether on a weekly timeframe reveals that the pair has been on a prolonged downtrend since mid-2023. This is characterized by the formation of lower highs and lower lows. However, the pair operates between the lower segment of the Bollinger band with a slight inclination towards the middle band. This price action suggests traders are indecisive despite moderate trading volume.
Presently, DOT/USDT operates under the dynamic moving averages at $4.995, which further reveals the existence of strong selling pressure. However, an upside retracement will be confirmed if the price can break above the middle band; otherwise, a break below the $3.303 level would signify the continuation of the overall market trend.
Both indicators in this analysis suggest a breakout from either side, yet the pair price is at $4.243, 7.34% short of the previous period.
Technical Indicator
Major Resistance Levels: $4.995, $6.688, and $7.800
Major Support Levels: $3.303, $2.800, and $2.900
Polkadot Technical Analysis
This analysis shows that Polkadot against Tether is in a consolidating phase between key levels. However, the tightened bands suggest low volatility, which normally precedes a breakout.
On the other hand, the Stochastic oscillator operates in the neutral zone, suggesting the pair can break in any direction. To this end, an upside crossover with the price breaking above the $4.995 level would signify an upside recovery; otherwise, a downward crossover with a price breaking below the $3.303 level would indicate a continuation of the current bearish trend.
DOT/USDT Analysis: Another Low or an Upside Retracement?
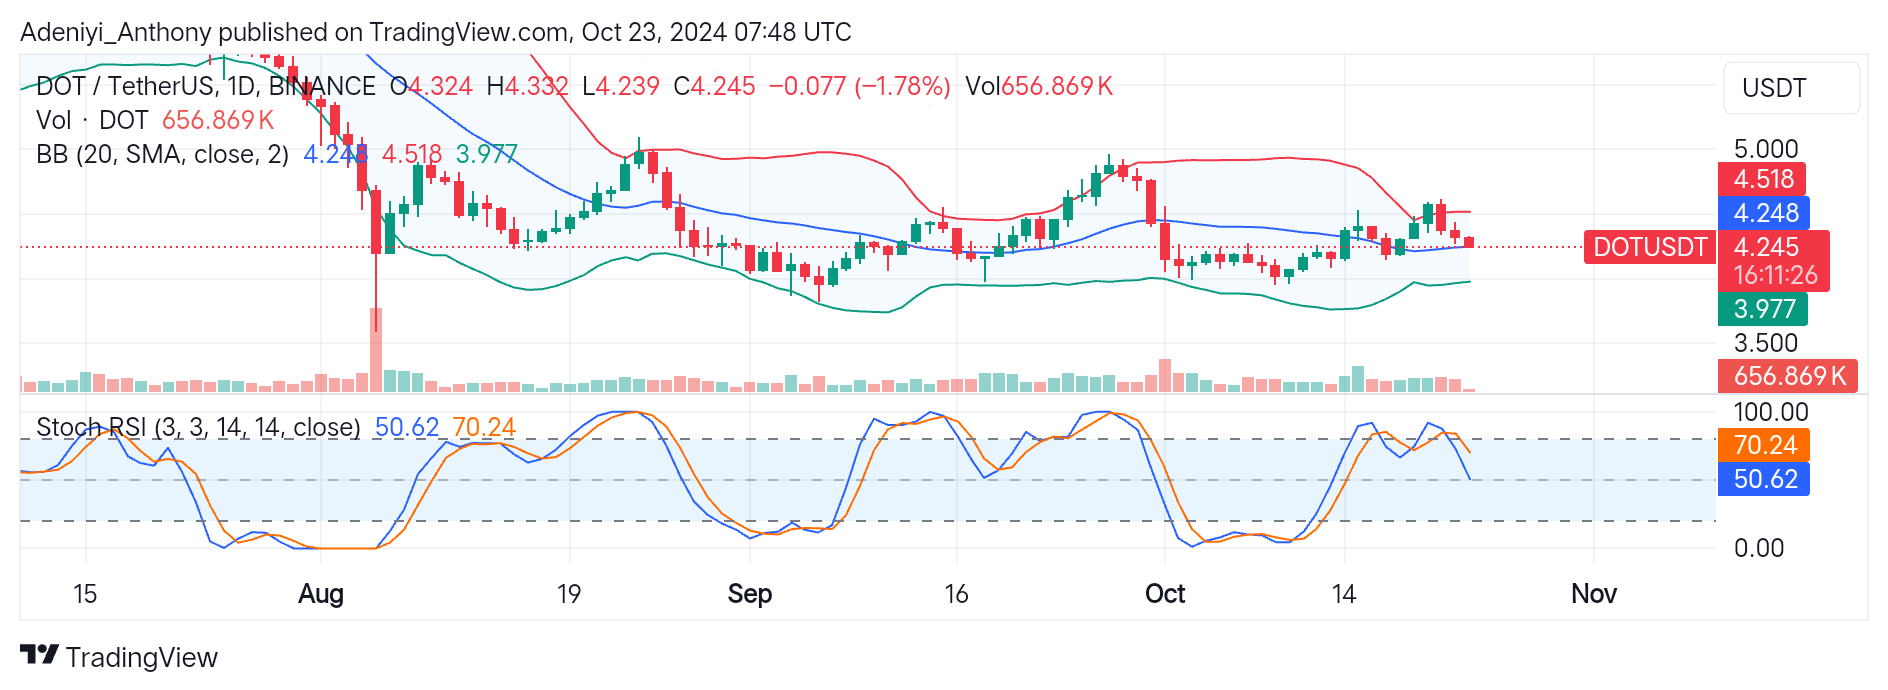
The DOT/USDT daily chart suggests the pair is at a critical point, with the bull and bears fighting for dominance after a previous fall to the middle band, which acts as a dynamic support.
In this timeframe, the narrow Bollinger bands suggest there is low volatility in the market and a breakout will soon happen. However, a break above $4.518 will indicate upside momentum, while a breakout below $4.230 will suggest a downtrend.
On the downside of the chart, the stochastic oscillator suggests a lack of interest from the bulls and bears, as the lines of the indicator point into the neutral zone. This means the price may take any direction, or consolidate around the current level.
You can purchase crypto coins here. Buy LBlock