Polkadot Continues Its Bullish Ascent, Aiming for a High of $10
Estimated Reading Time: 2 minutes
Don’t invest unless you’re prepared to lose all the money you invest. This is a high-risk investment and you are unlikely to be protected if something goes wrong. Take 2 minutes to learn more

Polkadot (DOT) Long-Term Analysis: Bullish
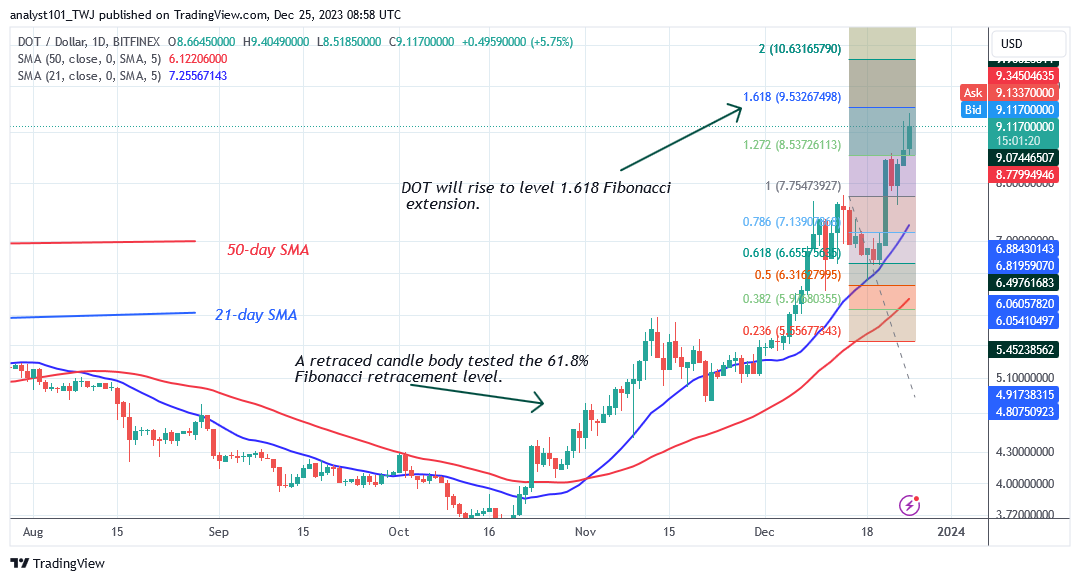
Polkadot (DOT) price has been reaching higher highs and higher lows as it aims for a high of $10. The crypto’s price has risen further, breaking through the $7.59 support level and breaking through the previous high. The present bullish momentum is predicted to peak at $10.00.
The price indicator now predicts that the altcoin will grow to level 1.618 Fibonacci Extension or $9.53. The altcoin has surged and is on its way to a high of $9.50. The market reached a high of $9.41 before reversing course. On the upside, DOT/USD is anticipated to reach the resistance at $10.00. On the downside, if the altcoin retraces above the 21-day SMA, the rally will resume.
Technical indicators:
Major Resistance Levels – $10, $12, $14
Major Support Levels – $8, $6, $4
Polkadot (DOT) Indicator Analysis
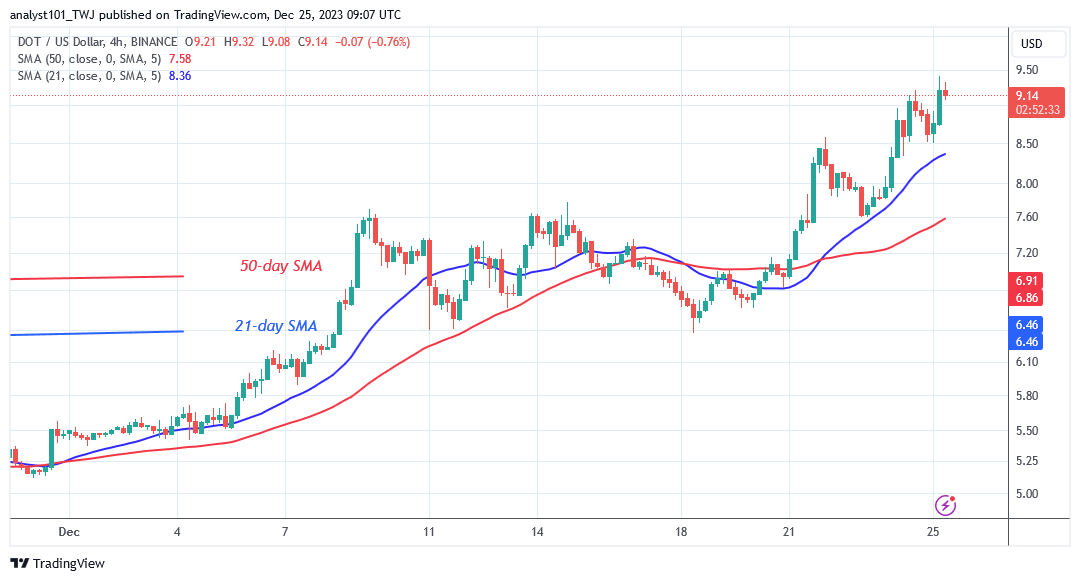
The 21-day simple moving average (SMA) of DOT has crossed above the 50-day SMA, indicating a bullish order. The price bars are above the moving average lines that allow it to rise. The altcoin is expected to be rejected as it reaches an overbought region.
What Is the Next Direction for Polkadot (DOT)?
Polkadot has maintained its bullish advance, breaking above the $7.60 resistance level as it aims for a high of $10. The cryptocurrency price drops to retest the $7.60 support level before continuing its upward trend. The recent rise peaked at $9.50 before reversing. The coin is approaching bullish exhaustion since the market is overbought.
You can purchase Lucky Block here. Buy LBLOCK
Note: Cryptosignals.org is not a financial advisor. Do your research before investing your funds in any financial asset or presented product or event. We are not responsible for your investing results
